Mid-infrared Spectrophotometric
Calibration for the New Generation of Large Telescopes - A solution to
the problem of calibrating data reliably
Fabiola Martín-Luis
Departamento de Astrofísica,
Universidad de La Laguna, Tenerife, Spain
Mark Kidger
Instituto de Astrofísica
de Canarias, Tenerife, Spain
Martin Cohen
University of California
at Berkeley
Summary
We examine the needs for
infrared calibration with the new generation of 8-10 metre class telescopes,
in particular the 10-m Gran Telescopio Canarias (GTC) which will enter
operation in the Roque de los Muchachos Observatory, La Palma, Canary Islands
in late 2003. Although our study is focussed towards mid-infrared calibration,
it is also applicable to the near infrared. The state of infrared calibration
is briefly examined, along with the problems of the currently available
lists of calibrators. We demonstrate that the current calibration lists,
particularly in the mid-infrared are inadequate for reliable calibration
of GTC observations and, by extension, observations with other telescopes
of a similar diameter. Apart from a low density of stars on the sky, the
majority of calibrators for 10 microns are almost 7 orders of magnitude
brighter than the sources to be calibrated; we show why both of these factors
may cause severe difficulties with data reduction if not remedied.
The second half of the
report deals with the progress that has already been made towards the resolution
of the problem of calibration, particularly the studies aimed at obtaining
an initial list of normal stars with reliable spectral type and good visible
photometry and that have a high density on the sky. We discuss a method
for templating highly accurate fluxes from 1-30 microns from the visible
colours and spectral type of a star of type AV or KIII that will allow
us to predict fluxes with great accuracy with a resolution R~30 000. This
resolution is well adapted to proposed GTC infrared instruments.
Our aim is to produce
an initial list of approximately 500 standard stars with highly accurate
calibration from 1-30 microns for Day 1 of the GTC and extend the list
to some 1000 stars within 3 years of this date. Work in progress has produced
an initial list of ~7000 candidate stars north of declination -44°
. MSX infrared photometry has been found for 881 of the stars included
in our all-sky survey, allowing us to extend the spectral coverage significant
fraction of these stars into the mid-infrared.
1 Introduction
1.1 The state of mid-IR
calibration stars
Infrared photometric calibration
lags many years behind the visible. Although some order has been put into
infrared calibration standards in the last few years, their state has traditionally
been chaotic. Each observatory tends to use its own calibration star list.
Traditionally little thought has been given even to the most elementary
process of elimination of unsuitable stars (e.g. variables), or to place
standard stars on a standard magnitude scale (usually accepted to be that
defined by Vega).
Whereas in the visible
there is a set of stars that are generally accepted by most observers and
observatories as defining the photometric standard (the Landolt stars,
Landolt (1983a, b)), there is no such facility available in the infrared.
The Landolt system has some deficiencies, however, these stars are known
and understood by all astronomers who take visible photometry. To calibrate
a field in the visible one observes a basket of stars over a night's observing,
taking care to cover as wide a range of airmass as possible. As the Landolt
stars cover a wide range of colours, one can obtain the extinction, photometric
zero point, its variation, and colour transformations in a single observation.
Discrepant stars can be discarded and an excellent overall result obtained.
In the infrared, there
is no such sequence of stars available. During the 1960s, '70s and '80s
a number of papers appeared presenting photometry in JHKLM of a large number
of stars of widely differing classes (e.g.: Johnson et al., 1966; Engels
et al., 1981; Korneef, 1983a, b; Glass, 1985). These papers with their
tabulated data were used as photometric calibration lists in many telescopes.
However, their deficiencies as calibration star lists were serious:
-
Problem: The observations
were taken mainly with small telescopes.
-
Consequence: The stars are
very bright. Typically, K < + 4. Many stars were too bright to be observed
even on 2-m class telescopes and are totally unusable for an 8-10-metre
class telescope such as the GTC.
-
Problem: No attempt was made
to select stars, adopting criteria of variability, peculiar or combined
spectra, binarity, etc.
-
Consequence: Many stars in
the published lists are variable or unsuitable as calibration stars for
other reasons than simply being too bright for modern detectors.
-
Problem: Most of the telescopes
used for the observations were in the Southern hemisphere.
-
Consequence: The northernmost
stars were equatorial, or only slightly north of the equator and a large
fraction are invisible from the latitude of the Canary Islands, or only
visible at high airmass and very few could ever be observed at low airmass.
-
Problem: Errors are large,
particularly in the fainter stars, but not explicitly presented.
-
Consequence: It is difficult
to gauge the reliability of the data for any star.
-
Problem: Multiple epoch observations
were not made.
-
Consequence: It is impossible
to reject uncatalogued variables.
-
Problem: No attempt is made
to link the observations to the zero point defined by Vega (a Northern
Hemisphere star unobservable from the Southern Hemisphere locations used
for most of the published observations).
-
Consequence: It is impossible
to know what the zero point is on the standard Vega scale.
A generous estimate of the
scatter in standard stars taken from such lists is that the errors are
5%, although 10% is probably closer to the truth in JHK and perhaps even
20% in L and M for most of the published lists that did not specially select
stars. Additionally, there is the problem that the passbands used are different
from paper to paper as there is no such thing as "standard" infrared filters.
In the Northern Hemisphere, the list originally published by Johnson (1965)
is one of the very few publicly available. This list though appears in
a publication that is not held by most libraries, was based on results
for very bright stars, with a low-sensitivity detector and does not include
the H band. It also suffers from the problem that different filter sets
were used for each of three sets of observations and, thus, the zero points
vary within the observing epochs included in the Johnson study.
In the mid-IR the situation
becomes progressively worse. A literature search finds just one published
paper that lists standard stars for 10 and 20 micron (Rieke et al., 1985).
This paper presents accurate 10 and 20 micron (N & Q bands) photometry
for 10 stars, all of which, apart from Vega, are of strongly negative magnitude.
Most Northern Hemisphere observatories base their mid infrared standards
on the list of stars published by Tokunaga (IRTF Photometry Manual, 1986).
Rieke et al. suggest that their accuracy is <5%, although experience
with mid-IR systems suggests that this figure may be optimistic.
The distribution of the
UKIRT mid-IR standard stars on the sky is shown in Figure 1 (10
micron) and in Figure 2 (20 micron) below. The Tokunaga stars (UKIRT
primary standards) are supplemented by some secondary standards gleaned
from the NASA catalogue of infrared data. Even at 10 micron there are some
regions of the sky as large as 40 degrees in diameter without a single
standard star.
Figure 1: The
sky distribution of 10-micron standard stars used at the United Kingdom
Infrared Telescope (UKIRT), at Mauna Kea (Hawaii). Most Northern Hemisphere
telescopes use mid-infrared standards based on a common list which forms
the core of the stars on this plot.
Figure 2: The
sky distribution of UKIRT 20-micron standard stars.
At 20 microns the surface
density of standards is very low. A second factor is the brightness of
the standards. In both the N (10 micron) and Q (20 micron) windows the
distribution of available standard stars peaks around magnitude - 2, as
shown in Figure 3. There is a small number of "faint" 10 micron
standards with magnitudes between +2 and +3 (eight, to cover the whole
sky) and a single standard of magnitude +4.
There is an evident need
for a more extensive network of standard stars that cover the sky to greater
depth.
Figure 3: The
distribution by magnitude of 10 and 20-micron standard stars in the UKIRT
list. Note that the major peak is at strongly negative magnitudes.
Of the 10-micron standards,
23 are primary standards with consistent photometry. The remaining 15,
including most of the faint standards, have been taken from the NASA Catalogue
of infrared data. This source has relatively large errors given that there
is no homogenisation of the data in the catalogue and it is included "as
is". When only the primary standards (i.e. those with reliable photometry
of known source) are included, the sky distribution, particularly of the
faint standards, becomes highly unsatisfactory, as seen in Figure 4.
Figure 4: The
sky distribution of 10 micron primary standard stars. Bright standards,
with their 10 micron magnitude equal to, or brighter than 0, are shown
in blue. Faint standards, with their 10 micron magnitude fainter than 0
are shown in red.
As can be seen from this
figure, the very few relatively faint standards that exist are all distributed
in a small radius around a ~12 hours. In other words, their sky visibility
is highly limited and, during part of the year, no faint standard is observable.
1.2 Why introduce an
all-sky network of calibration stars?
The current network of
Northern Hemisphere stars suffers, as we have seen, from a series of serious
defects that make it highly unsatisfactory for use in the Gran Telescopio
Canarias (GTC).
-
Low absolute precision
-
No careful selection criteria
applied to list
-
Low spatial density
-
Only extremely bright stars
are available
1.2.1 A lesson from the
past
Every time that there
has been a major improvement in the performance of infrared instrumentation
there has been a major problem with calibration. In most cases the improvements
in the calibration has lagged years behind the instrumentation. A good
example of this was the introduction of the first near-IR array detectors.
When introduced little or no thought had been given to the problem of how
to calibrate them in normal astronomical observation. Observatories found
that the standard star lists that had been used for some years with photometers
were unsuitable for calibration, as the stars in those lists were too bright
to be observed with the new, more sensitive, array detectors. It has only
been in the mid-1990s, more than 10 years after array detectors first became
available in the near-IR, that standard star lists suitable for medium
to large telescopes have been published. These lists now include stars
as faint as magnitude K=12 - however, they remain totally inadequate for
telescopes of 8-10m class that will reach a limiting magnitude around K=25.
Experience from the Carlos
Sánchez Telescope has shown that the availability of a good photometric
calibration system usually lags years behind the availability of the instrument
that requires it. Even in large international telescopes this rule has
held almost without exception.
1.2.2 Absolute accuracy
of calibration
Even if we accept that
the errors on the best stars in the calibration lists is 5%, this value
is still poor compared to other ranges of the electromagnetic spectrum.
In fact, 5% is probably optimistic and the true error is 10% or greater.
This provides a fundamental limitation to the accuracy of observations.
Even if there are no other source of error and in the most favourable observational
circumstances, it will never be possible to calibrate 10 and 20-micron
data with a better accuracy than this. Evidently, in normal astronomical
conditions, with a variable atmosphere and photon statistics included,
one would be lucky to obtain a final error better than double this value.
A second factor is that
the poorer the knowledge of the absolute calibration and the less self-consistent,
the larger the number of flux standards that need to be observed to calibrate
a data set. When the absolute calibration is well defined, a good calibration
can be obtained on a night of photometric quality, with just 3 or 4 observations
of a single star at a wide range of airmasses. Where no good absolute calibration
is defined, the same night will require the observation of a basket of
a minimum of 15 to 20 stars to obtain minimally reliable data. If such
a large number of stars cannot be observed, the data for the night may
be completely worthless and valuable telescope time wasted.
When a reliable calibration
network is available, the amount of time dedicated to absolute calibration
on a single night can be reduced from perhaps 25-30% to <10% and, simultaneously,
the accuracy of the data greatly increased. The aim must be to obtain an
accuracy of ~1% or better in the standard star lists, similar to the best
lists of bright 1-2.5-micron standards.
1.2.3 Selection criteria
Few standard star lists
have applied rigid selection criteria to the stars to be included. Scrutiny
of a typical list will find a mixture of "normal" stars, with variables
(some of quite large amplitude), binaries, stars of unusual spectra, etc.
Rarely are the calibration data acquired at different epochs ever compiled
to check stars for photometric stability. When one considers the UKIRT
calibration star list one finds a number of stars rejected as possible
standards for the Carlos Sánchez Telescope because of their known
variability. There are also several more stars that have been rejected
later from the Carlos Sánchez Telescope (CST) standard star list
(Kidger, 1993), as they were found to be significantly variable at JHK
(in one case, with amplitude ~0.2 magnitudes).
Experience has shown that
a reliable photometric system can only be obtained when rigid selection
criteria are employed to select only stars that are suitable as photometric
standards and care is taken to define the zero-point for the system carefully.
A study of a sub-set of the Carlos Sánchez Telescope standard star
list (Cohen et al., 1999) has revealed that the largest zero point offset
in the CST data is 0.001 magnitudes (in J and L').
1.2.4 Spatial density
Less importance is given
to the spatial density of standard stars than is desirable. With the advent
of the GTC this factor will become extremely important. In the CST, one
of the principal drivers in the design of the standard star list was the
time occupied in telescope slews, and the extreme lack of suitable standard
stars to the north of the celestial equator. For a telescope with a rather
slow slew rate such as the CST, it was found that up to 5 minutes could
be lost in pointing alone for each standard star observed. Although the
GTC will have a much more rapid slew than the CST, when the optimisation
of use of telescope time is a key factor, it is desirable to have a density
of standard stars in the sky sufficient to ensure that only rather small
telescope slews will be necessary.
Particularly in queue
observing mode, when efficient use of telescope time is essential, having
a high density network of stars is vital as, in most cases, each observation
will demand its own individual calibration.
A second and extremely
important factor is the need to match the source and calibration backgrounds
due to the fact that for a large part of the mid-IR the sky flux dominates
and thus any error in background determination has a disproportionate effect
on the accuracy of measurements (see below).
1.2.5 The brightness
of current calibrators
A key factor in mid-IR
data reduction and, indeed, any data reduction at all at l > 2.5micron,
is the assumption that the sky may be exactly subtracted, even though the
sky flux may be many orders of magnitude greater than the source flux.
Any slight non-linearity in sky subtraction will have serious consequences
for the data, particularly as mid-IR observing depends on the summation
of many frames. Unless the sky sums exactly as white noise, each new additional
frame will introduce an error into the summation. It is precisely because
for much of the mid-IR regime (although not all of it) the sky+star >>
star that one must test that the subtraction of sky works exactly on known
sources of low flux level.
However, given the current
state of photometric calibration, if one simply observed a random standard
star with a 10-m class telescope from the existing list of "reliable" flux
standards then:
-
It would usually saturate.
-
If the standard star used
to calibrate the data were not close to the target, flexure, sky, sky gradients,
etc would all be different. It only requires a different 2nd spatial derivative
to seriously degrade the accuracy of the chopping+nodding procedure.
-
Ideally one wants to customise
a standard to be as close as possible to the target pointing so that the
attitude of the cryostat is as similar as possible. If this is not done,
the differences in flexure, boresight, chopping character all change substantially
on a 10-m class field-of-view.
The goal must thus be to
observe a standard that is so similar to the target (each with sky of course)
that the algorithms for sky subtraction are operating on identical circumstances
for both the target and its calibrator.
However, as we have seen,
the majority of available calibrators have a magnitude ~- 2 at 10-microns.
In contrast, the GTC+CanariCam (the GTC's planned mid-IR camera-spectrograph)
will be aiming to reach a magnitude limit N~ 15. Hence the available calibrators
are typically 17 magnitudes brighter than the sources to be observed (close
to 7 orders of magnitude). To ensure an accurate calibration it is important
to observe standard stars that are of similar magnitude to the sources
to be calibrated, thus ensuring that the sky subtraction algorithms work
in nearly similar circumstances for source and calibrator. It may be argued
that, as the sky dominates the source in most cases, the difference between
"faint source" and "bright calibrator" is considerably less than 7 orders
of magnitude. However, with such a large difference between source brightness
and calibrator brightness it only requires a minimal non-linearity in the
detector to make the sky subtraction unreliable (in addition to the effects
detailed above).
However, it's not always
true that the sky is enormously brighter than every target. Figure 5
shows the atmospheric transmission at Mauna Kea for a 1.2-mm water vapour
column (we expect conditions at least this good on ³ 10% of the nights
on the GTC). Note how a significant part of the 10-micron window (shown
on an expanded scale in Figure 6) has close to 100% transmission.
Even the 20-micron window has regions suitable for low background narrow-band
photometry and spectroscopy with a transmission ~97%.
Figure 5: The
atmospheric transmision at Mauna Kea, calculated with the IRTRANS4 routine
for a 1.2-mm column
of precipitable water vapour and R=3000.
As we can see in Figures
5 & 6, a significant fraction of the operational wavelength range
of the GTC+CanariCam will have low atmospheric background. The ultimate
limit in these ranges is always the 270-290K black body sky emission, combined
with the GTC's own emissivity.
We thus have to deal with
two main regimes. One, principally from 10-12.5 microns, but also to a
lesser degree at 8-9 microns and close to 18 microns, is a low sky emissivity
regime where the (low) telescope and optics emissivity dominate the sky
background and thus the source is relatively bright compared to the sky.
The second regime is the high emissivity one, for example at 7.7 microns
in the water edge, or 2.6-2.8 micron water edge, or at 9.6 microns in the
ozone line, etc.
Figure 6: As
Figure 5 showing the 10-micron window at Mauna Kea with an exploded scale.
A third important factor
in the case of the GTC is the pixel size on CanariCam. With small pixels
and diffraction-limited seeing, the solid angle of sky+telecope is minimised
per pixel, thus minimising the effects of the background on a faint target
star.
2 Building up a suitable
all-sky calibration network
2.1 The issues
There are several independent
requirements that we have defined above.
-
One needs a network of calibration
stars across the entire sky visible from the Canaries.
-
To support both spectroscopy
and imaging, calibrators must be provided for the entire usable wavelength
range of the MIR spectrographs/imagers, roughly from 3 to 30 microns.
-
Calibrators must be created
far in advance of our knowledge of the actual optical response curves of
the combination of CanariCam's detector + optics + filter + atmosphere.
-
These calibrators must be
rigorously constrained so that, for both imaging and spectroscopy, usage
of the brighter members of the network will yield the same output voltages
for input physical irradiance values as the faintest stars, after correction
for detector non-linearities on the basis of Laboratory characterisations.
-
It must be possible to trace
the lineage of any calibrator and to relate it to other ground-based and
spaceborne calibration systems.
-
To set this in context, CanariCam
will require MIR calibrators that are at brightest between 1000 and 10000
times fainter than the reference stars currently available. Ideally, we
require calibrators to close to the limiting magnitude of the telescope.
-
Further, CanariCam's calibrators
must span a dynamic range appropriate to all the instrument's imaging and
spectroscopic modes, and with relevant spectral resolutions.
2.2 Our approach to the
problem
One of our team (M. Cohen)
has spent much of the past 9 years working specifically on the creation
of absolute stellar calibrators. Another, (M. Kidger) spent more than 5
years working on the definition of the standard star system for the Carlos
Sánchez Telescope (still in use and unmodified since then).
The products generated
by Cohen and his colleagues have appeared in the literature as a series
of ten papers and are widely available. In Paper X (Cohen et al., 1999)
the photometry of the CST standard stars was combined with observations
at other telescopes and previous work to provide an all-sky network of
radiometric stars with very accurately defined photometry over the range
from 1-20 microns (the J to Q photometric bands). This paper thus effectively
produces a unification of all significant published near and mid-infrared
calibration systems
These calibrators are
confined to the range K0-M0IIIs, for which the combination of observed
airborne and spaceborne spectra have made complete 1.2-35micron spectral
coverage a possibility for at least one bright archetype of each spectral
type. These have already supported the needs of OSCIR on the Keck, where
a calibrator was required below 6 Jy at 10 microns in a particular region
of the sky, in OSCIR's specific bands.
Paper X presents a set
of 422 calibrated stellar spectra forming an all-sky network fainter than
the primary (Sirius), or secondary standards (e.g. a Tau), but entirely
consistent with them. The calibration framework of these stars already
supports DIRBE, IRTS, MSX, and ISO. Self-consistency has already been tested
by spaceborne observations from the IRTS, ISO, and MSX.
Building on this secure
foundation we can address issues 1, 2, 3, 4, and 5: the fainter elements
of the network defined in Paper X provide the bright portion of the new
network with all-sky coverage. The creation of complete absolute spectra
readily provides calibrators for ANY well-characterised passband lying
entirely in the range 1.2 to 35m m; the constraints that already govern
these calibrators have yielded traceability and self-consistency, tested
from space primarily via the rigorous programme of absolute calibration
on MSX. In this fashion, CanariCam's measurements will share a common heritage
with these space-based archives, facilitating transparent intercomparisons
of spectra and photometry from a variety of diverse instruments.
2.3 Extending the network
for GTC calibrators
We now address issue 6.
This is not a trivial requirement. Its achievement will necessitate highly
specialised methods to provide complete wavelength flexibility, independent
of the eventual choice of any specific imaging passband or grating. The
faintest current calibrators still have an IRAS 12micron flux density of
5 Jy and about 1.5 Jy at 25 microns. CanariCam needs the network to be
extended down by a factor of ~4000 at N, or 1000 at Q. To permit near-IR
calibration on the GTC, which is a logical extension of this work, the
network must be extended even further at 1-5 microns.
The method proposed is
a modular approach, by which we plan to develop and test such a network
in readiness for CanariCam's first light, which is planned for 2003.
2.3.1 The "Landolt"
stars
As the initial approach
to the extension of calibrators (by a factor of about 100--1000 in brightness)
there is a potential to use "supertemplates" (i.e. intrinsic spectral shapes
for each K0-M0III spectral subclass covering the range 0.11-35micron),
applied to the set of Landolt stars in the celestial equator. For these
several thousand objects, Landolt has furnished exquisitely well-measured
UBVRI data.
For these stars, the steps
are:
-
To use the optical colours
to determine the reddening, predict the NIR (JHK) and MIR (IRAS/MSX) brightness
and test these predictions against observations.
-
To make NIR measurements
(with the CST, as its passbands have already been accurately characterised
and calibrated in Paper X) to test the method by comparing measured fluxes
with template predictions.
-
If we can predict JHK to
within a few hundredths of a magnitude then we can pursue this approach
for K0-M0III stars with V~ 9-15, K~ 5-11. This will create an adequate
number of K0-M0III calibrators in the northern sky, this time using all
available optical, NIR and MIR photometric data.
An essential ingredient,
of course, is a reliable spectral type for each Landolt star. Only about
200 of the approximately 850 Landolt stars have any spectral type at all,
usually no more than a Harvard class with no sub-division or luminosity
class, so that ground-based spectroscopy may also be needed to support
this technique. One observing programme in this sense, completely independent
of our efforts, has already started at McDonald Observatory. We have also
observed some 240 Landolt stars that are found from their colours to be
potentially type A and K, spectroscopically using the 2.5-m Isaac Newton
Telescope in La Palma.
We will also investigate
the option to use Hipparcos/Tycho optical photometry (Hp, Bt, Vt bands)
to assess reddening and provide optical normalisation of the templates.
Beyond this, we will use fainter stars and their NIR photometry, drawn
from DENIS and 2MASS, if cross-identifications provide reliable spectral
types.
2.3.1.3 Hipparcos/Tycho
stars
Recently, an alternative
and highly attractive option has become available. As part of the calibration
effort for the WIRE satellite, investigation of the Hipparcos database
allowed stars of any given spectral type to be separated for magnitudes
as faint as V=12. The Hipparcos database includes complete and detailed
information on every star, including a spectral classification. The database
also provides complete information that allows the acceptability of a star
for calibration to be determined based on criteria for spectral class,
variability, binarity, and colour.
This avoids many of the
complications of the alternative Landolt programme. Stars may be easily
separated by spectral class, searching for the types of interest. Those
stars with unusual spectra may be rejected. Known and Hipparcos-observed
variables are flagged in the archive and may be easily rejected. A further
benefit is that the luminosity class of a star may be checked by using
the Hipparcos parallax, combined with the observed magnitude. This allows
possibly mis-classified stars to be reliably identified.
After selection of the
stars to be studied further, the process proceeds in an identical fashion
to that for the Landolt stars described above.
A great advantage of the
Hipparcos programme is the fact that it also allows main sequence class
A stars (AV) to be separated easily too. These stars have the major advantage
over KIIIs that their colours are virtually zero. Whereas a moderately
KIII star of magnitude V=10 will have N~6 (too bright for our photometric
needs), an AV of V=10 will have N=10. Thus, to obtain some faint standards
adapted to the mid-IR calibration needs of the GTC we only need to extend
the calibration down to AV stars of V~12, although to reach a fainter limit
would be more desirable. This is a significant disadvantage of this sample
over the Landolt stars as the latter reach a magnitude limit of V=17, even
fainter than our requirement.
2.3.3 Broadening the
types of star templated
2.3.3.1 A-type stars
K/M-giant templates are
not the only intrinsic spectral shapes that can be employed though they
are the only ones with a solid, continuous-in-wavelength, empirical foundation.
One can rely also on hot and solar-type stars if one is willing to adopt
purely model atmospheres to generate their emergent spectra (as was also
used for some calibrators on ISO). Model spectra are used identically to
the fully-observed K/M-giant template spectra in that one normalises them
by observed NIR and MIR photometry. The chief advantage of A-dwarfs is
that one does not require visually such faint stars as for cool giants
in order to attain faint MIR magnitudes.
-
Progress to date
After careful consideration
of the issues it was decided that the best approach to use initially in
this study would be to take advantage of the stars selected for the WIRE
mission but which, with the loss of the mission, would otherwise not be
used. The initial selection process was simple. The Hipparcos catalogue
was searched for the strings: "AV" and "KIII" and all stars selected that
fell in the range from A0V to A5V and from K0III to M0III were saved to
an individual file for each spectral division (i.e. A0V, A1V, K0III, K0.5III,
etc.). For AV stars no further criterion was used, for KIII stars, two
further criteria were applied. Stars selected for spectral type were rejected
if their parallax was found to have been measured to better than 10 sigma
(suggesting that they could be mis-classified nearby dwarfs) or their (B-V)
colour index was larger than +1.5.
These files formed the
basis of the initial lists. For the AV stars the initial distribution over
the sky was as seen in Figure 7. Note that there is a sharp cut-off
in the sky distribution at Dec.=-12°. This is seen in the distribution
of all types of stars within the Hipparcos catalogue. The cut-off corresponds
to the declination limit of the southern objective prism spectral surveys.
As the declination limit of the GTC straddles this more heavily observed
band of the sky it is inevitable that, with the strong southern bias in
the stars selected, many of the stars will only be observable at high airmass
from the GTC. 
Figure 7: The
distribution on the sky of type AV stars after the initial selection from
the Hipparcos catalogue. The solid horizontal line marks the horizon limit
for the GTC.
Note too that, somewhat
unexpectedly, the Milky Way is barely seen in the distribution. This is
due to the fact that most of the type AV stars in the Hipparcos catalogue
are comparatively local and thus show an all-sky distribution.
Figure 8: The
distribution on the sky of type KIII stars after the initial selection
from the Hipparcos catalogue. The solid horizontal line marks the horizon
limit for the GTC.
For the type KIII stars
(Figure 8) the effect is even more pronounced. More than 80% of
all the stars are concentrated below the Dec.-12° cut-off point. A
second strong concentration is seen in the North Galactic Pole, close to
R.A.=12 hrs, Dec.=+40°.
Despite the large number
of stars in the sample, the strongly non-homogeneous distribution means
that some areas of the sky are heavily over-sampled, while others already
begin to show significant gaps in coverage.
-
First steps in the selection
of stars
Once all the input files
are prepared, each with complete information about the star (magnitude,
co-ordinates, spectral type, colour, parallax, etc.) the first step is
to define a series of selection criteria to reject unsuitable stars.
We start with:
|
13 914
|
stars of type KIII |
|
3 607
|
stars of type AV |
The first step was to
reject all stars flagged as variables by Hipparcos. This includes all variables
known previously to the Hipparcos mission and all the stars for which Hipparcos
detected a scatter in the data larger than can be accounted for by the
errors. This step removes only a small number of rather strongly variable
stars and can be seen as an initial coarse filter.
The following step is
to examine more closely the spectral classification of the remaining stars.
As Hipparcos gives a complete spectral designation this can be checked
for a number of undesirable characteristics, for example, binarity, peculiar
spectrum, uncertain or incomplete spectral classification, etc. For example,
a star with a spectral type shown as A1V+O7I would be rejected, as would
a designation of A3p, or K2II/III. The remaining stars are later checked
in the SIMBAD database, where ambiguous or contradictory classifications
are revealed (e.g.: a conflict between SIMBAD and Hipparcos spectral data
for a star).
These first two steps
remove most seriously unacceptable stars (spectral binaries, variables,
and unusual spectral and possibly wrongly classified stars). However, this
relies on the Hipparcos criterion and on available data in the Hipparcos
database. The following steps make a finer sifting of the stars to remove
remaining variables of lower amplitude and possible undetected close binaries.
To detect variables we
study the error associated with the Hipparcos magnitude Hp).
We expect variables to reveal themselves by deviating strongly from the
trend defined. We also expect the error to increase as a function of the
observed magnitude, with fainter stars having poorer photometry. The plot
obtained is shown in Figure 9.
Figure 9: The
variation of the error in the Hipparcos magnitude against magnitude for
the selected stars from the Hipparcos catalogue. A few strongly variable
stars can be seen with particularly large errors.
The results in Figure
9 make it obvious that there are a significant number of unflagged
variables in the data set. When we centre on stars with smaller errors,
expanding the scale until the maximum error is 5%, we see the expected
strong trend of error against magnitude (Figure 10). Even in this
range we see that there are a significant number of obvious low-amplitude
variables undetected within the data set.
Figure 10: The
Hipparcos error against the Hipparcos magnitude for the stars selected
from the Hipparcos catalogue. The line marks the best least squares fit
to the data.
A least squares fit is
made to the distribution and a least squares fit calculated. We then eliminate
any star whose error deviates more than 4 sigma as being a probable variable.
This figure is chosen to avoid giving a large number of false detections
of variability. If we were to accept, for example, a 2 sigma criterion,
we would expect to wrongly eliminate almost 1000 non-variable stars, given
that 1 in 18 stars would be expected to give this deviation or greater
just by Poisson statistics.
A similar criterion is
used to eliminate possible unresolved binaries. We find that some stars
have an unexpectedly large error in their parallax determination. One possible
cause of this is that the star is an unresolved, or barely resolved binary.
A similar plot to Figure 10 shows that a significant number of stars
are possible astrometric binaries. One again we see, as expected, that
the error in the parallax depends on the magnitude of the star. However,
in this case the relation is somewhat different. We find that there is
a constant error on the parallax measurement down to magnitude 6 (Figure
11), and then an exponential increase at fainter magnitudes (Figure
12).
We use the same criterion
as previously that any star deviating by more than 4 sigma is assumed to
be a possible astrometric binary and rejected.
All possible variable
and close binary stars have, at this stage, been rejected.
With the remaining stars
a close scrutiny is made of the spectral classification using the information
found in the SIMBAD database. Where information is contradictory, doubtful,
or incomplete, the star is assumed to be unsuitable for our purposes and
rejected. This process required a careful star by star search of the SIMBAD
database.
Figure 11: The
error in the measured parallax against the Hipparcos magnitude for the
stars brighter than V=6 selected from the Hipparcos catalogue.
Figure 12: The
error in the measured parallax against the Hipparcos magnitude for the
stars fainter than V=6 selected from the Hipparcos catalogue. A significant
number of stars are well off the top of this plot.
The following step is
to search for visual doubles or wider binary systems that might potentially
cause difficulties during observations. In many cases the existence of
a companion will not affect the star's suitability as a calibrator. However,
as the diffraction limit for the telescope is 0.2 arcseconds and some closer
systems will have a separation not very much larger than this value, contamination
by a companion star may be a problem in a number of cases. There is also
the danger that a bright companion could saturate data.
These doubles and binaries
are thus separated, but not eliminated, as they can still be of use to
fill in significant gaps in sky coverage. A separate set of files is prepared
with suitable stars that are listed as double in the ADS catalogue of visual
doubles.
The final stage is to
separate too the stars that are normal and fulfil all the selection criteria,
but are observed to have strong CN lines in their spectrum. These stars
are of uncertain value to us until the impact of this spectral characteristic
can be evaluated. Similarly, stars that are normal but whose spectral classification
falls between two types are also separated (e.g. K3III/K3.5III).
We thus now have three
large groups:
Totally normal stars with
no detectable anomaly.
Double and binary stars
that are otherwise totally normal.
Otherwise totally normal
stars with strong CN lines.
The first of these groups
is our prime sample, the second and third groups may be used if gaps appear
in sky coverage to fill inconvenient holes.
Finally, we separate the
stars southwards of declination -44° . These are valid stars for calibration
and for testing of the models (e.g. against satellite observations), but
of no interest as standard stars for the GTC.
3.2 The current state
of the data set
After the different phases
of elimination detailed above the state of the database is:
| |
Initially
|
After elimination
|
|
K III
|
13 914
|
5 801
|
|
A V
|
3 607
|
1 438
|
|
Totals
|
17 521
|
7 239
|
These represent the set
of stars that may potentially be used to calibrate infrared data on the
GTC. The distribution of these stars on the sky is seen in Figure 13
for type AV (above) and KIII (below).
Note that some areas of
the sky show significant gaps in coverage, particularly of the type AV
stars. Some regions as large as 30° across are found to lack type AV
stars, although the sky coverage of type KIII is more complete. In some
regions of the sky it is evident that both the type KIII stars and the
type AV are heavily over-sampled and that only a small fraction of the
stars need be used finally.
Figure 13: The
distribution on the sky of the totally normal stars selected with the criteria
described above. As previously, the solid horizontal line marks the horizon
limit of the GTC.
3.3 The extinction
correction
An essential part of the
technique of templating is the extinction correction, tilting the stars
the correct amount to compensate for interstellar extinction. However,
interstellar extinction is difficult to apply accurately, even for nearby
stars. All stars will be reddened to a certain degree by interstellar matter
in the line of sight. The Hipparcos data set allows us to use this effect
to make a first order check of the spectral classification.
For type A0V stars we
can start from the principle that their (B-V)=0.00, thus any colour different
to zero is due to colour excess from extinction, or misclassification.
For an A0V star we assume
that:
MV = +0.70
B-V= 0.00
We also know the parallax
for all the brighter A0V stars, with at worst, a 3 sigma precision. Thus,
we can make two independent estimates of the distance of the star.
Given that:
AV=3.2·E(B-V).
Where AV is
the total line of sight extinction in the visible and E(B-V) the colour
excess in (B-V) caused by the extinction.
We assume a plane parallel
atmosphere of scale height 0.11kpc, with a mean extinction of 0.7 magnitudes
per kiloparsec. Thus a star at high Galactic latitude, at distance "D"
from the Sun, is assumed to have a line of sight extinction AV=0.7mags/kpc
up to distance "x" (the limit of the Galactic disk) and AV=0.7
henceforth (Figure 14).
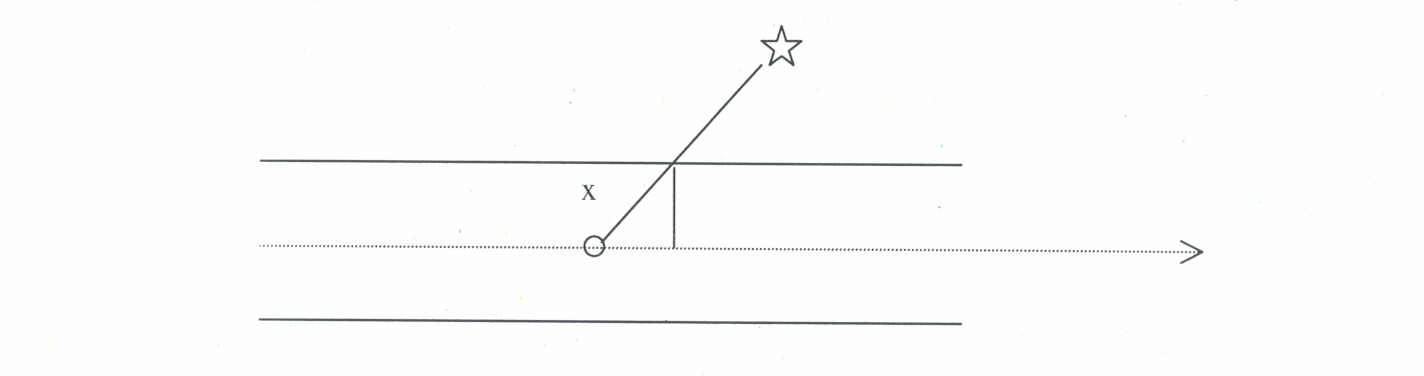
Figure 14: The
plane parallel atmosphere assumption used to calculate the line of sight
extinction in the text.
Note that a star at low
Galactic latitude may be wholly within the disk. We can thus use the parallax
to calculate the distance of the star and its expected extinction and the
observed colour to calculate the observed extinction. This allows us to
calculate if a star's observed colour and magnitude are consistent with
its distance, or not. In some cases it is probable that stars are mis-classified.
Others appear to have very large line of sight extinctions (i.e. are seen
behind relatively dense clouds in the Interstellar Medium) and are thus
unsuitable for that reason. An example of this effect is shown in Figures
15 & 16.
Figure 15: The
observed (B-V) colour (y axis) against the modulus of the Galactic latitude
(x-axis) for all selected stars of type A0V. A significant number of stars
have strongly red colours with (B-V) up to 1.3 magnitudes, therefore we
reject them as potential calibrators.
Figure 16: The
observed (B-V) colour (y-axis) against the modulus of the Galactic latitude
(x-axis) for all selected stars of type KIII. A significant number of stars
have strongly blue colours with (B-V) as low as +0.5 magnitudes and may
be assumed to be misclassified, therefore we reject them as potential calibrators.
Figure 17: The
percentage excess extinction over the expected 0.7mag/kpc as a function
of the distance to the star in kpc. We expect to see larger errors in nearby
stars as other effects dominate the extinction term.
When applying this technique,
we find that the line of sight extinction to some of the stars in the sample
needs to be as great as 14 magnitudes/kpc (20 times the expected value)
to explain the observed colours (Figure 17), therefore we reject
them as potential calibrators.
To date, we have only
investigated the type A0V stars in detail. Some 50 stars are found to have
colours that imply either very large line of sight extinction, or misclassification
of the spectrum. In a few cases, as can be seen in Figure 15, the
colour is even bluer than expected. However, most of these stars are close
to the Galactic Plane, suggesting that dense local clouds are responsible
for highly reddening the stars (Figure 18). In the case of the KIII
stars (Figure 16), we see that a significant fraction of stars have
much bluer colours than expected. In many classes the colours are consistent
with a type KV rather than a KIII, although it is also possible that some
stars are misclassified as GIII, or even GV.
Figure 18: The
type AV stars with the most inconsistent colours. Note how most of them
are confined to the plane of the Milky Way, with a large concentration
of stars close to the Galactic Centre. In most cases we may thus assume
that these stars are seen behind relatively dense local clouds in the Interstellar
Medium. However, a significant number of stars have inconsistent colours
despite being at high Galactic latitude and are thus, probably miss-classified.
In the case of the KIII
stars we have only made an initial approach to the problem. These stars
were already selected in such a way that objects with very red colour were
excluded. However, there is still a potential confusion with stars of type
GIII, or KV, which have similar spectral characteristics and can be mistaken
for a KIII in an objective prism search. The number of stars that are seen
to have much bluer colours than expected for a type KIII gives support
for this. A significant fraction of the sample has (B-V)~+0.8, similar
to the expected colour for a type KV star (Figure 16).
The lines of work in progress
at present are:
-
Further study of the extinction
correction, particularly in relation to the AV stars. Only when these are
completed will the work be extended to the type KIIIs.
-
Rejection by colour of mis-classified
stars.
-
Cross-checking of the final
list of normal stars (all-sky) against the MSX and IRAS catalogues to search
for stars with spaceborne infrared photometry.
-
A search for catalogues of
faint type AV stars and of faint K giants.
-
An observing programme to
measure JHK colours for some 200 stars from the selected list (this programme
was initiated in 2000).
-
Identification of candidate
KIII and AV stars from the Landolt lists from their visible colours and
in quasar fields from their visible and infrared colours and the observation
of their spectra to confirm their spectral type.
-
Extension of Landolt's photometry
to much fainter stars (V~19-20) in quasar fields and in selected areas
observed by Landolt. Information on and results from this programme can
be found in González-Pérez et al. (2001) and in Kidger et
al. (2001).
When these tasks have been
completed the next stage of the task is to de-redden the spectra of the
selected stars and to build up the first slice of templates.
The templated fluxes will
then be compared with the measured fluxes at the CST to demonstrate the
validity of the method.
Further details of work
in progress may be found in Martín-Luis et al. (2001, a, b) and
in Kidger et al. (2001). A demostration of the validity of the template
method with real data for a type KIII star can be found in Cohen (2001).
3.5 Problems identified
We have identified a number
of additional problems that must be treated to produce a complete and adequate
product. In some cases these relate to difficulties found in the course
of the studies reported here.
-
The need for faint AV
stars
Within our sample there is
a strong bias towards brighter stars. We find less than a dozen type AV
stars of magnitude 10<V<12 that would be directly suitable as calibration
stars for the mid-infrared (Figure 19). This leads to an urgent
need to find a reliable alternative source of AV stars in the range 10<V<15.
Efforts are under way to find suitable sources working through the NASA
ADC. This problem does not invalidate our work as the stars that will be
observed initially will be used to verify the method of templating and
will be used to link the calibration to the fainter layer of stars that
we require.
-
The extinction correction
This correction is most important
at short wavelengths. However, as the B and V colours are used as the reference
point for the templated spectrum, the effect is important. We find that
the local extinction is far from homogenous with dense clouds being identifiable
in our data. Further study of this issue is required. At present, the best
approach appears to be to use a tough cut-off to eliminate stars will relatively
high line of sight extinction (AV>1.0).
Figure 19: The
type AV and KIII stars in our final selection that are fainter than V=10.
The large cluster of stars close to the North Galactic Pole are all of
type KIII and thus brighter than is desirable for calibration. This diagram
demonstrates that at least a second layer of fainter stars is necessary
to complete our calibration network to an acceptably faint magnitude.
References
Cohen, M.: 1994, A.J.,
107, 582
Cohen, M.: 1998, A.J.,
115, 2092 (Paper IX)
Cohen, M.: 2001, "Stellar
clibration in the Infrared: extending the legacy of KAO, ISO and MSX to
SIRTF and beyond", In "The Calibration Legacy of the ISO Mission", ESA-SP
481 (ESA, Noordwijk). In Press.
Cohen, M., & Davies,
J. K.: 1995, MNRAS, 276, 715 (Paper V)
Cohen, M., Walker, R.
G., Barlow,m. J., & Deacon, J. R.: 1992a, A.J., 104, 1650 (Paper I)
Cohen, M., Walker, R.
G., & Witteborn, F. C.: 1992b, A.J., 104, 2030 (Paper II)
Cohen, M., Witteborn,
F. C., Bregman, J. D., Wooden, D. H., Salama, A., & Metcalfe, L.: 1996a,
A.J., 112, 241 (Paper VI)
Cohen, M., Witteborn,
F. C., Carbon, D. F., Augason, G., Wooden, D., Bregman, J., & Goorvitch,
D.: 1992c, A.J., 104, 2045 (Paper III)
Cohen, M., Witteborn,
F. C., Carbon, D. F., Davies, J. K., Wooden, D. H., & Bregman, J. D.:
1996b, A.J., 112, 2274 (Paper VII)
Cohen, M., Witteborn,
F. C., Walker, R. G., Bregman, J. D., & Wooden, D. H.: 1995, A.J.,
110, 275 (Paper IV)
Engels, D., Sherwood,
W. A., Wamsteker, W., & Schultz, G. V.: 1981, A&AS, 45, 5
Glass, I. S. 1985, Irish
Astron. J., 17, 1
González-Pérez,
J.N., Kidger, M.R., & Martín-Luis, F.: 2001, A.J. (In press,
October 2001)
Johnson, H.L.: 1965, Communications
of the Lunar and Planetary Laboratory, 3, 73
Johnson, H. L., Mitchell,
R. I., Iriarte, B., & Wisniewski, W. Z.: 1966, Commun. Lunar Planet.
Lab., 4, 99
Kidger, M.R.: 1993, Carlos
Sánchez Telescope Technical Note Series, #16
Kidger, M.R., González-Pérez,
J.N., Martín-Luis, F., & Cohen, M.: 2001, "The search for faint
infrared calibration standards - extending Landolts standards to V=19",
In "The Calibration Legacy of the ISO Mission", ESA-SP 481 (ESA, Noordwijk).
In Press.
Koornneef, J.: 1983a,
A&AS, 51, 489
Koornneef, J.: 1983b,
A&A, 128, 84
Landolt, A.U.: 1983a,
A.J., 88, 439
Landolt, A.U.: 1983b,
A.J., 88, 853
Martín-Luis, F.,
Kidger, M.R., & Cohen, M.: 2001, "Calibration requirements for CanariCam
on the Spanish Gran Telescopio Canarias (GTC)", In "The Calibration Legacy
of the ISO Mission", ESA-SP 481 (ESA, Noordwijk). In Press.
Martín-Luis, F.,
Kidger, M.R., & Cohen, M.: 2001a, "Selection of sample of suitable
potential mid-infrared calibartion stars from the Hipparcos-Tycho catalogue",
In "The Calibration Legacy of the ISO Mission", ESA-SP 481 (ESA, Noordwijk).
In Press.
Martín-Luis, F.,
Kidger, M.R., Hough, J., Packham, C., & Lehto, H.: 2001b, "Spectropolarimetric
calibration of CanariCam: development of a network of calibration sources
for polarimeters on large telescopes", In "The Calibration Legacy of the
ISO Mission", ESA-SP 481 (ESA, Noordwijk). In Press.
Rieke, G., Lebofsky, .
& Low, F.: 1985, AJ, 90, 900
Tokunaga, A.T.: 1986,
IRTF Photometry Manual
Tokunaga, A. T., Golisch,
W. F., Griep, D. M., Kaminski, C. D., & Hanner, M. S.: 1986, A.J.,
92, 1183
Walker, R.G., & Cohen,
M.: 1992, "Atlas of Selected Calibrated Stellar Spectra" (NASA Contractor's
Report, CR-177604)
 Back to the CanariCam Science Page.
Latest update: November
19th 2001
Pages maintained by: Mark Kidger