Optical and Near-IR Followup
Followup at IAC
The people in the collaboration is participating in an extensive program of follow up of the ELAIS sources. In this page we describe mainly the observations carried out in the IAC but also give a summary of the observations carried out in other institutes.
- Summary of the followup observations.
- Optical Observations.
- Near-IR Observations.
- Optical Spectroscopy
Summary of the followup observations
All northern areas are completely observed in the R band down to a magnitude limit of ~23 (INT WFC). Radio observations of about 4 sq. degrees have been done using the VLA. Observations in the V and I bands (IAC80 and OGS) and H band (CIRSI at INT) has been performed in about 1 sq. degree in the center of the regions where deeper ISO data is available. Spectroscopy of a sample of sources has been done with CAFOS in Calar Alto. There exist also pointed observations in J and K of a hundred of ELAIS sources.
Optical Observations: IAC80 and OGS
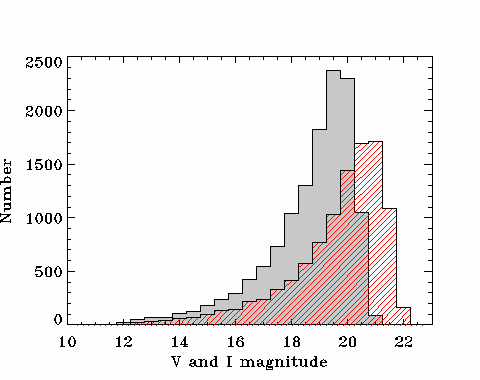
The observations were carried out on May and June, 1998. The priority was to observe in V and I bands those regions previously covered in the INT CIRSI run. Fifteen minutes exposures were taken except in the ten times repeated CAM region in N1 where we did 3 times longer exposures going 1.5 magnitudes deeper. The rest of the area covered by the CAM TEST raster and not observed by CIRSI was also covered in V and I. Then, these observations cover around 1 sq. degree.
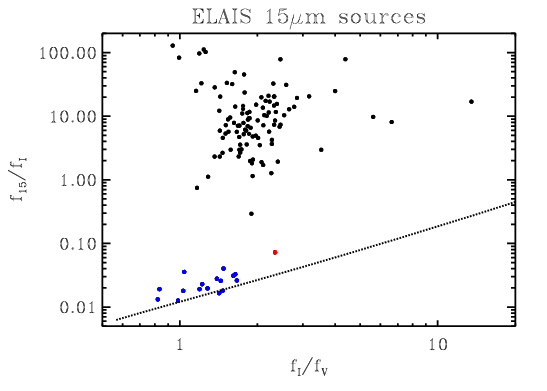
The data is actually full reduced and a catalogue of ~8000 sources is available. First cross correlations have been done with ELAIS sources, using a simple distance algorithm. A color-color diagram is shown below. Association of sources using the likelihood ratio method of Sutherland & Saunders is in process.


As an example you can see a mosaic done covering the region of 10 times repeated observations with CAM at 15µm (region overplotted in green).
NIR Observations: CIRSI at INT
The run was carried out by Ismael Pérez Fournon, Richard McMahon, Eduardo González and the CIRSI group on 10th, 11st and 12nd of May, 1998. The filter used was H broad the first night and H long the second and third one. Weather was good except the first night where the data are non photometric. Around 0.8 sq. degrees was observed.
The Cambdrige InfraRed Survey Instrument is a camera based on 4 Rockwell Hawaii HgCdTe 1024x1024 detectors. The pixel scale is 0.453" providing a field of view of about 8' for a single array. This means that with 4 contiguous exposures you can map a field of view of about 30'.
The data is actually reduced. The new version of the reduction software has solved the problems that appeared in the previous reductions. Astrometry solutions have been calculated and a catalogue of sources will be available soon. There exist some calibration problems that need to be solved.
Spectroscopic Optical Observations
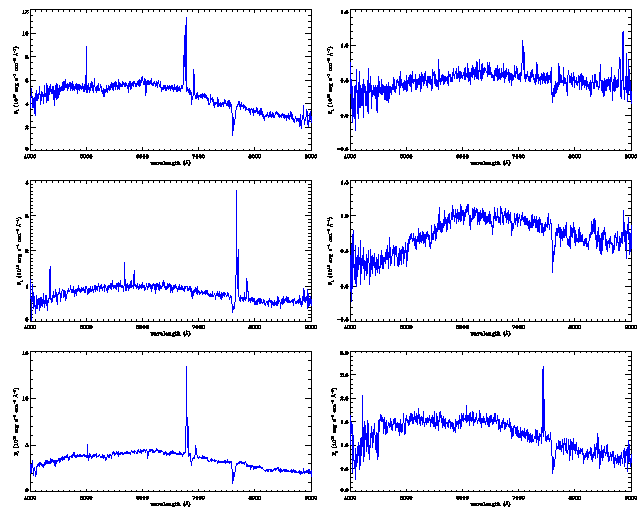
We used the Calar Alto 2.2m telescope and the Calar Alto Faint Object Spectrograph (CAFOS) to observe a sample of ELAIS sources. The Observing dates were July 28 and 29, 1998 and the weather was good. The spectral coverage is 4000 to 8000 Angstroms with the G200 grism, of 4.5 A/pixels. There are some sources observed with the red grism R200.
We selected a small, but complete, sample of galaxies detected at 90 micron within the area observed with the VLA in the N2 region (Ciliegi et al. 98). All PHOT sources had clear radio, CAM (15 micron), and optical (DSS) counterparts. The optical counterparts were bright enough for observations with CAFOS. All of them, excluding a few IRAS galaxies with known redshifts, were observed.
Most of the objects show emission lines (two of them are AGN) and the redshifts are less than about 0.3. Given the large positional errors of the PHOT 90 micron sources, the radio positions are really helpful to know which are the counterparts.
For this sample all the objects are detected at 15 micron, probably because most of them are bright at 90 micron and they are located in the CAM test raster area where the CAM limiting fluxes are lower. This may not be the case for other PHOT samples (in N1 or at 175 micron).
