| Science with PACS - Examples |
|---|
What is the cosmic history of star formation and AGN activity?
| Simulated deep PACS survey of 10E-5 sr at 75, 110 and 175 Ám (false colors) to a 1 σ limit of ~0.5 mJy (50h). Deepest sources are at z~3. |  |
- Deep multi-band photometric surveys and spectroscopy of objects at the peak of cosmic star formation (z=1...3). At these redshifts the PACS wavelength range samples the emission peak of actively star forming galaxies. |
How does stellar mass loss influence the ISM chemistry?
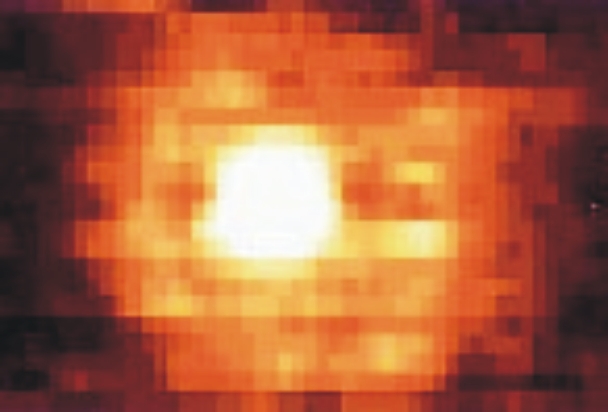
| - Photometric mapping and spectroscopy (e.g. CO, H2O, OI) of the circumstellar matter in evolved objects. Spatially resolving envelopes and shells of evolved stars will help to better understand mass loss and the latest phases of stars. |  |
The carbon star Y CVn. ISOPHOT 90 Ám map (Izumiura et al. 1996) |
How do stars form out of the interstellar medium?
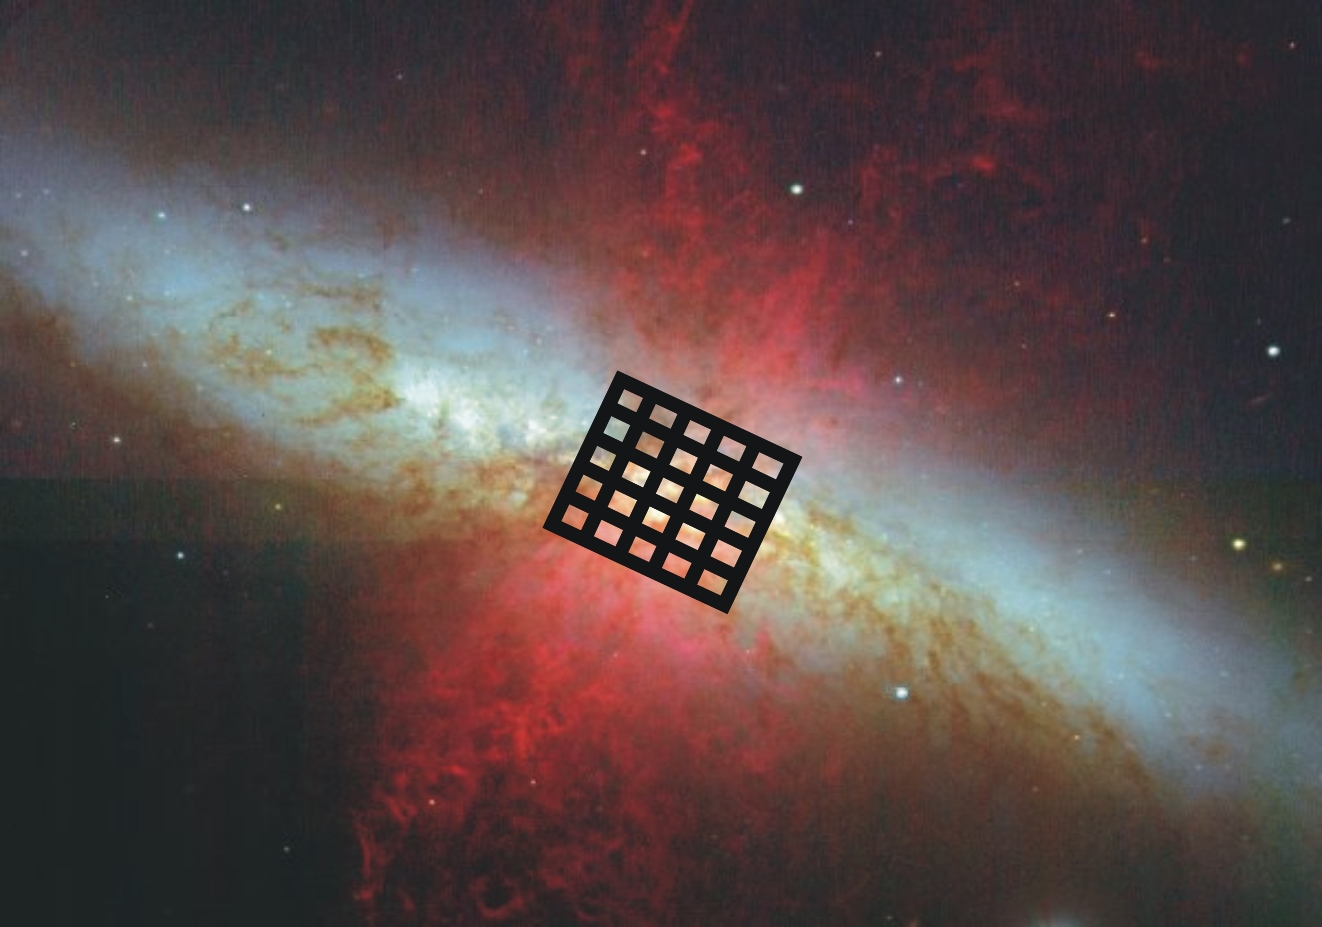
| M82 (Subaru/FOCAS) with the PACS spectroscopy FOV overlayed | 
|
- Local galaxies: photometric and spectral line mapping for detailed, spatially resolved studies of star formation on galactic scales. PACS will be able, e.g., to trace for the first time the different warm/cold dust components in arms, interarm regions, star forming complexes, etc. - Photometric surveys of nearby molecular clouds: search for protostars, pre-stellar condensations, young stars (all young stellar objects emit mainly in the wavelength range of PACS/Herschel). Resolve debris disks around young stars with planetary systems in formation. |
What has been the history of our solar system?
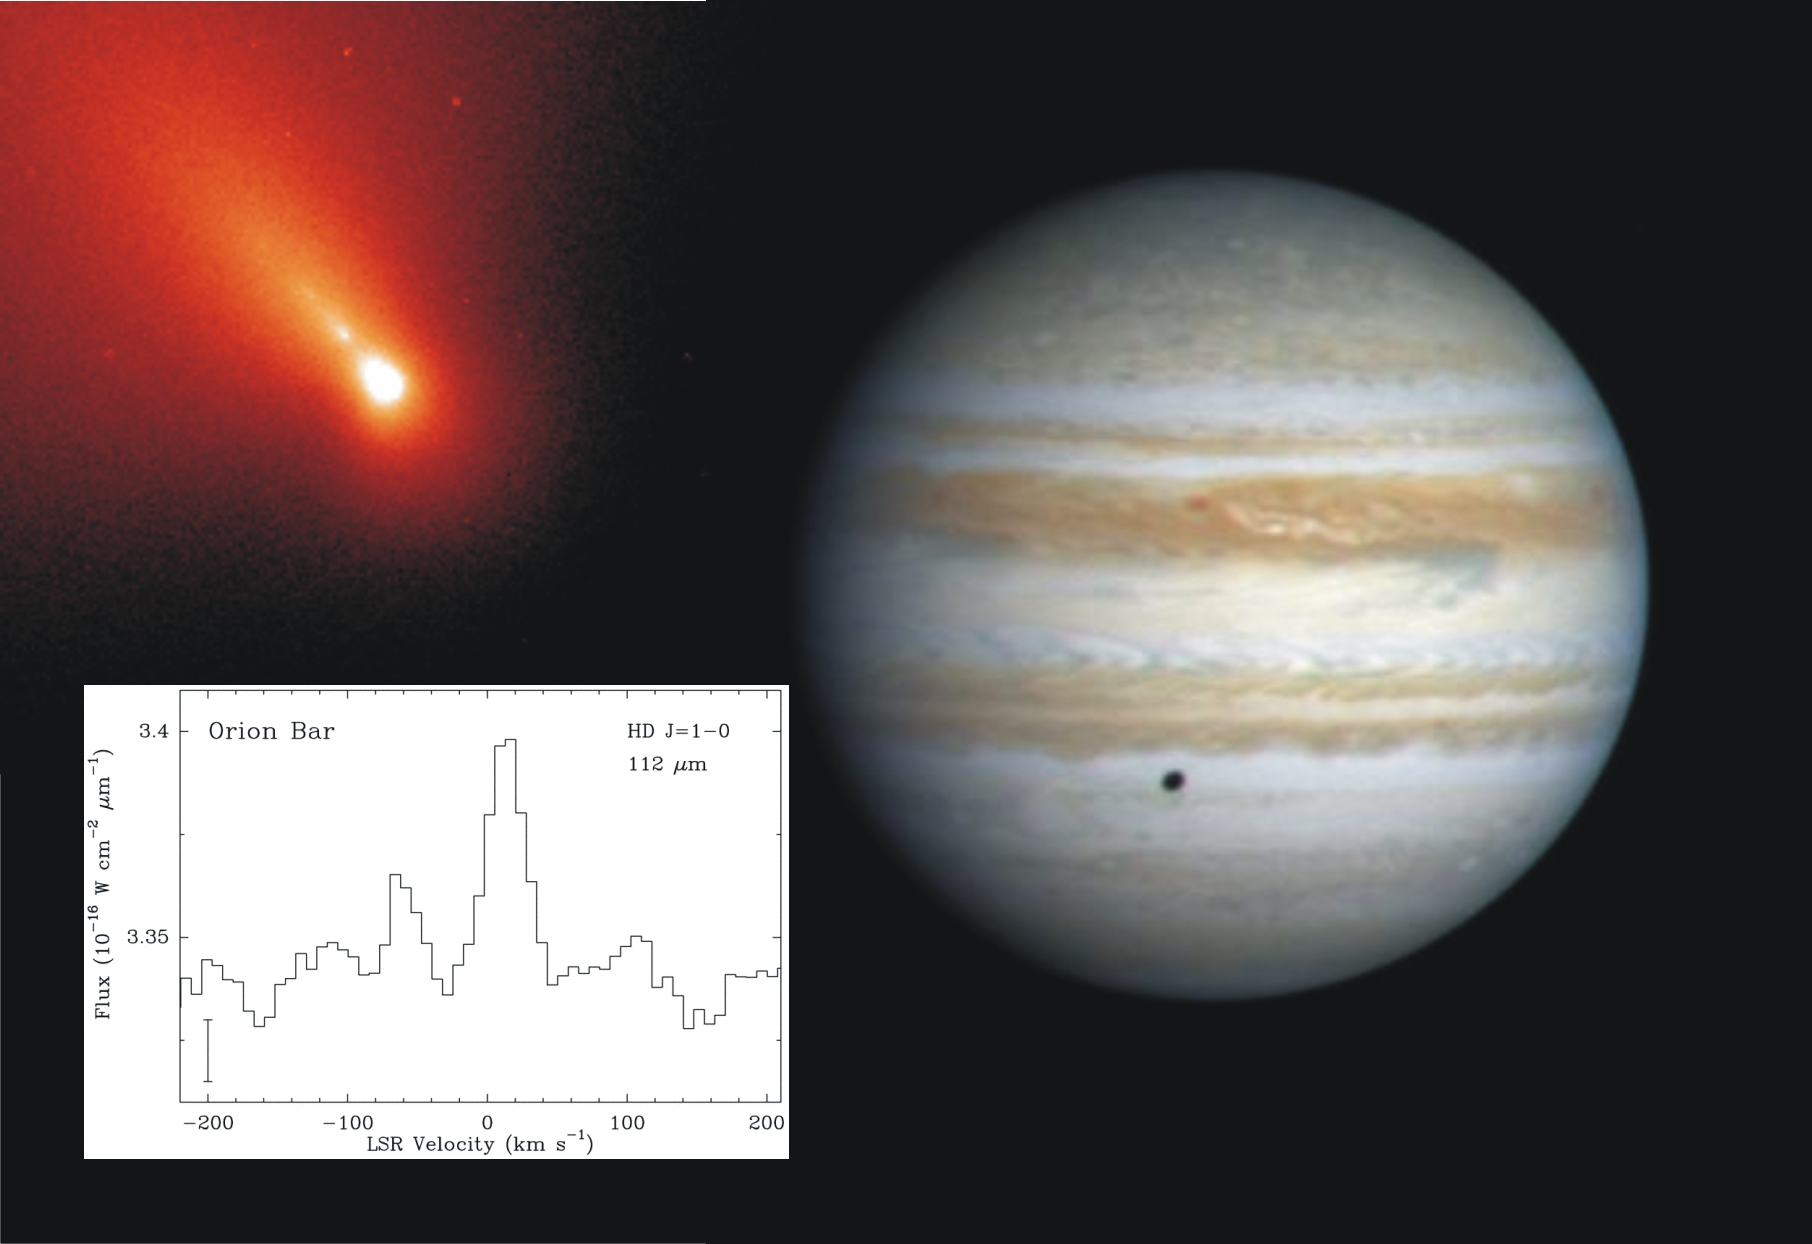
| HD Spectrum: Wright et al. 1999 | 
| - Imaging of faint comets and asteroids - Spectroscopy of giant planet atmospheres: composition, profile, origin of water - HD line: D/H ratio in Solar System bodies and our close galactic environment probing the composition of pre-solar grains |