My Research Interests. Physics of the Cosmological Recombination
The Cosmological (bound-bound) Recombination Spectrum

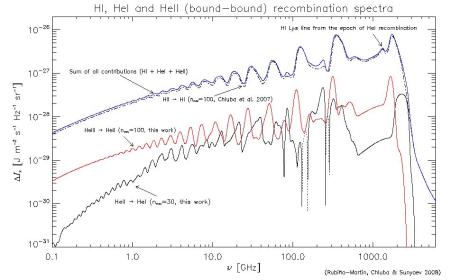
In a series of three papers ( Rubiño-Martin, Chluba & Sunyaev 2006; Chluba, Rubiño-Martin & Sunyaev 2007; Rubiño-Martin, Chluba & Sunyaev 2008), we have calculated the contributions to the cosmological recombination spectrum due to bound-bound transitions in the hydrogen (HI), helium (HeI) and single-ionized helium (HeII). Our final computations are presented in the figure above. The data files used to produce this figure can be downloaded here:
- HI recombination spectrum (from Chluba et al. 2007). [data]
- HeI recombination spectrum (from Rubiño-Martin et al 2008). [data]
- HeII recombination spectrum (from Rubiño-Martin et al 2008). [data]
- HI spectrum arising from HeI recombination (from Rubiño-Martin et al 2008). [data]
- Total spectrum (sum of all previous). [data]
The details of the assumptions and physics for each computation can be found in the previous papers. If you use any of these data files, please cite the following two references: Chluba, Rubiño-Martin & Sunyaev (2007) and Rubiño-Martin, Chluba & Sunyaev (2008).
The imprint of cosmological hydrogen recombination lines on the angular power spectrum of the CMB
In J.A.Rubiño-Martín, C.Hernández-Monteagudo & R.A.Sunyaev (2005, A&A 438, 461), we explored the imprint of the cosmological hydrogen recombination lines on the angular power spectrum of the cosmic microwave background (CMB). The final version of the paper can also be found in astro-ph/0502571.
We have prepared several movies showing the dependence of the signal with the observing frequency (probed redshift). These movies are in two formats: animated GIF (use any browser to see them) and MPG format (use mpeg_play).
- Movie 1. Dependence of the change in the angular power spectrum with the observing frequency (= redshift of the line). We illustrate this case for the three main transitions of the Balmer, Paschen and Brackett series.
- Movie 2 [GIF] [MPG]. For the H-alpha line, we show the dependence of the change in the angular power spectrum with the position of the line during recombination. For comparison, the primordial CMB power spectrum is also displayed, but rescaled by a factor 10^ {-4}. Note that in this plot, thick lines represent positive change in the power spectrum, while thin lines represent a negative change.
- Movie 3 [GIF] [MPG]. We show the dependence of the linear term of the correction to the power spectrum due to coherent scattering in a line during recombination. Again, thick lines represent positive change in the power spectrum, while thin lines represent a negative change.