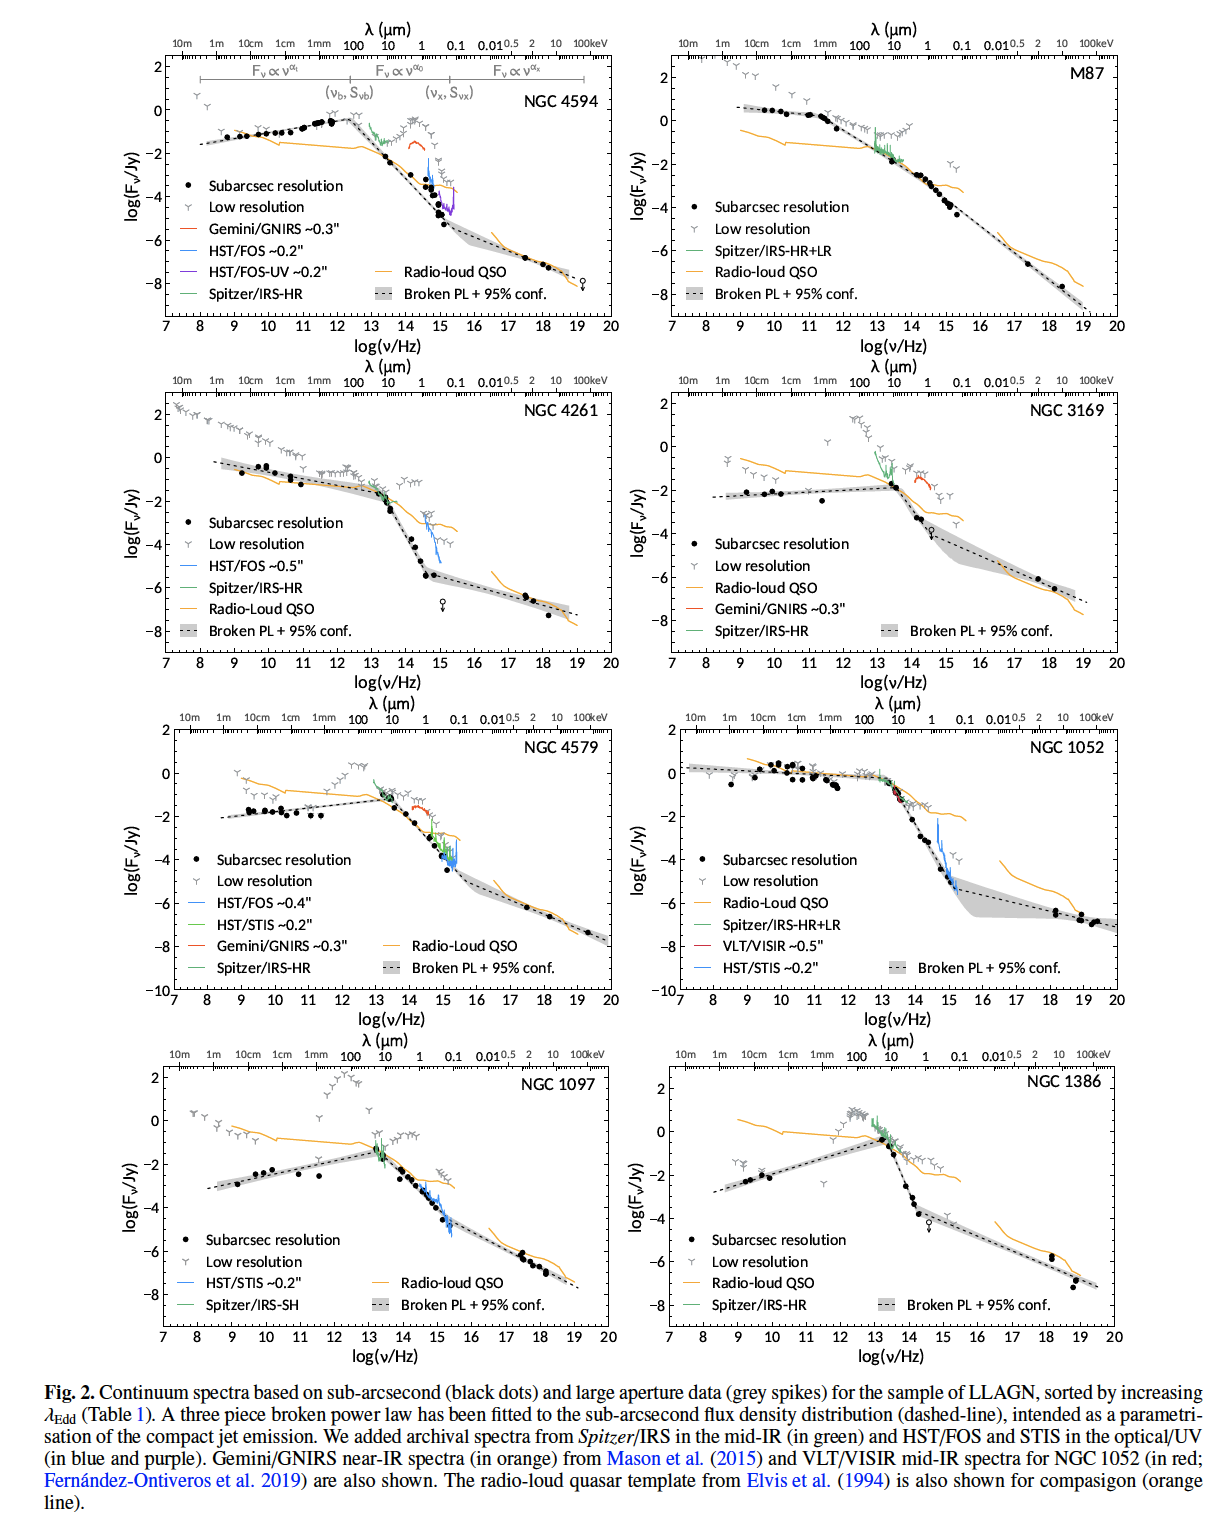
High spatial resolution SED of nearest prototype LLAGN (Fernandez-Ontiveros et al. 2023)
Subarsec resolution SEDs of prototype, near LLAGNs are available at the CDS via anonymous ftp to cdsarc.cds.unistra.fr (130.79.128.5) or via https://cdsarc.cds.unistra.fr/viz-bin/cat/J/A+A/670/A22
Average high spatial resolution SED of Seyfert galaxies
The average SED template in tabular form are found here for the type 1- and for the type 2- Seyfert galaxies studied in Prieto et al. (2010). First column is frequency, nu in Hz, second is power, nu*Fnu, in relative units. Prior averaging, each galaxy SED was normalized to the mean value of its power distribution. The normalized spectra were then averaged. The average SEDs span the range 1.e+9 - 1.e+20 Hz with two gaps: 2.3e+15 Hz - 2.4e+17 Hz (extreme UV to X-rays) and 1.e+12 - 1.e+10 Hz (far-IR to the millimeter).
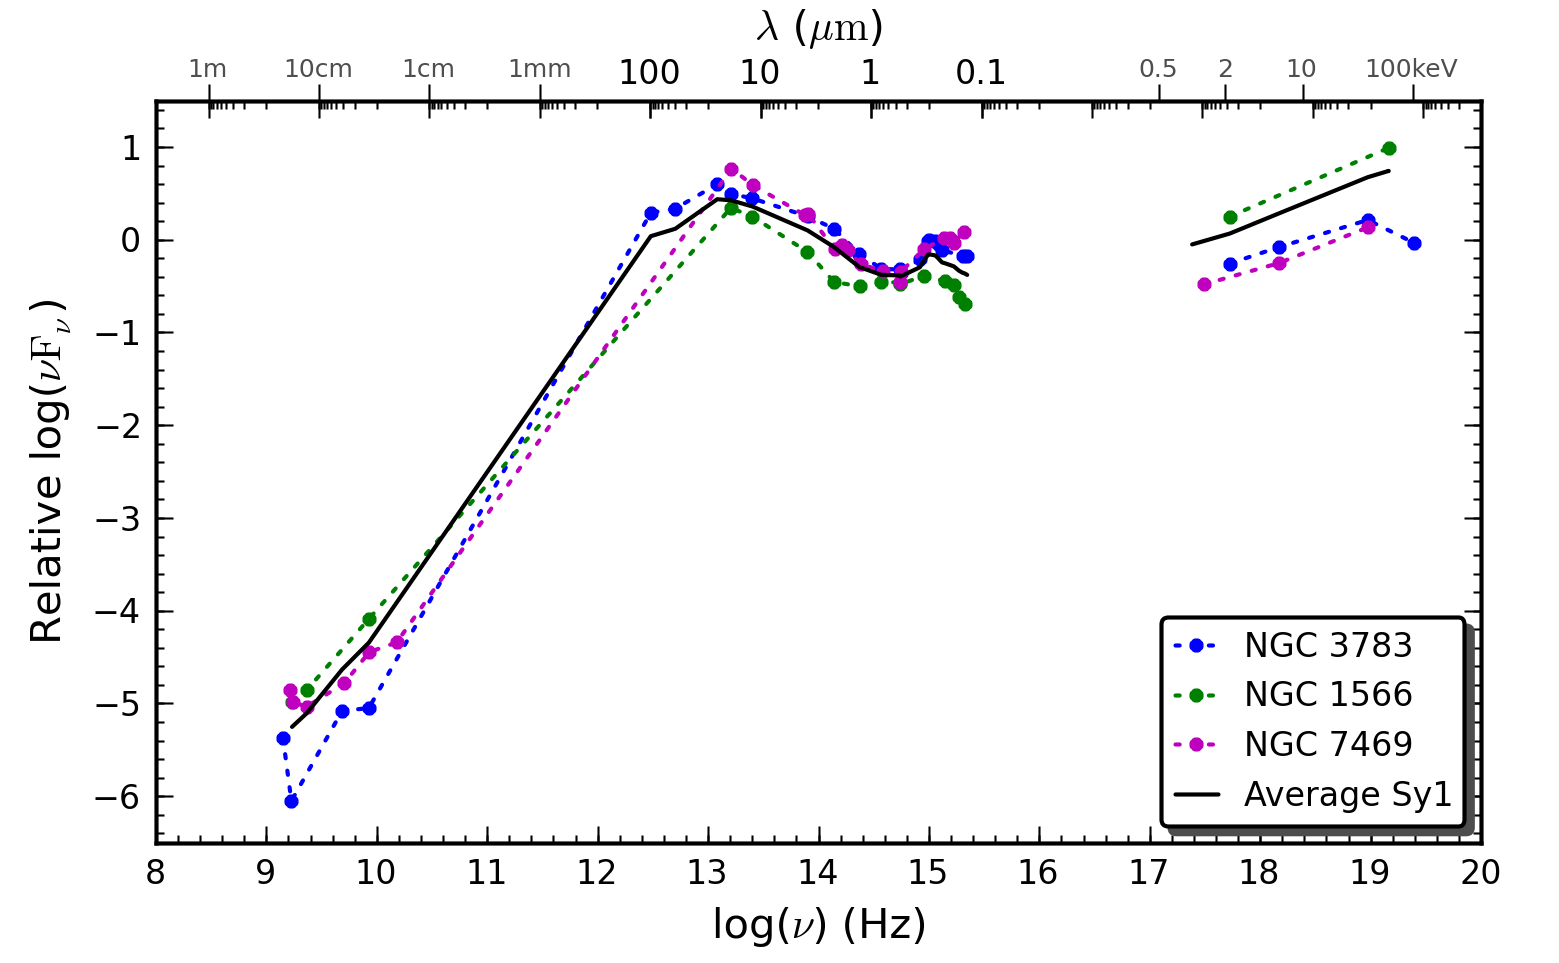
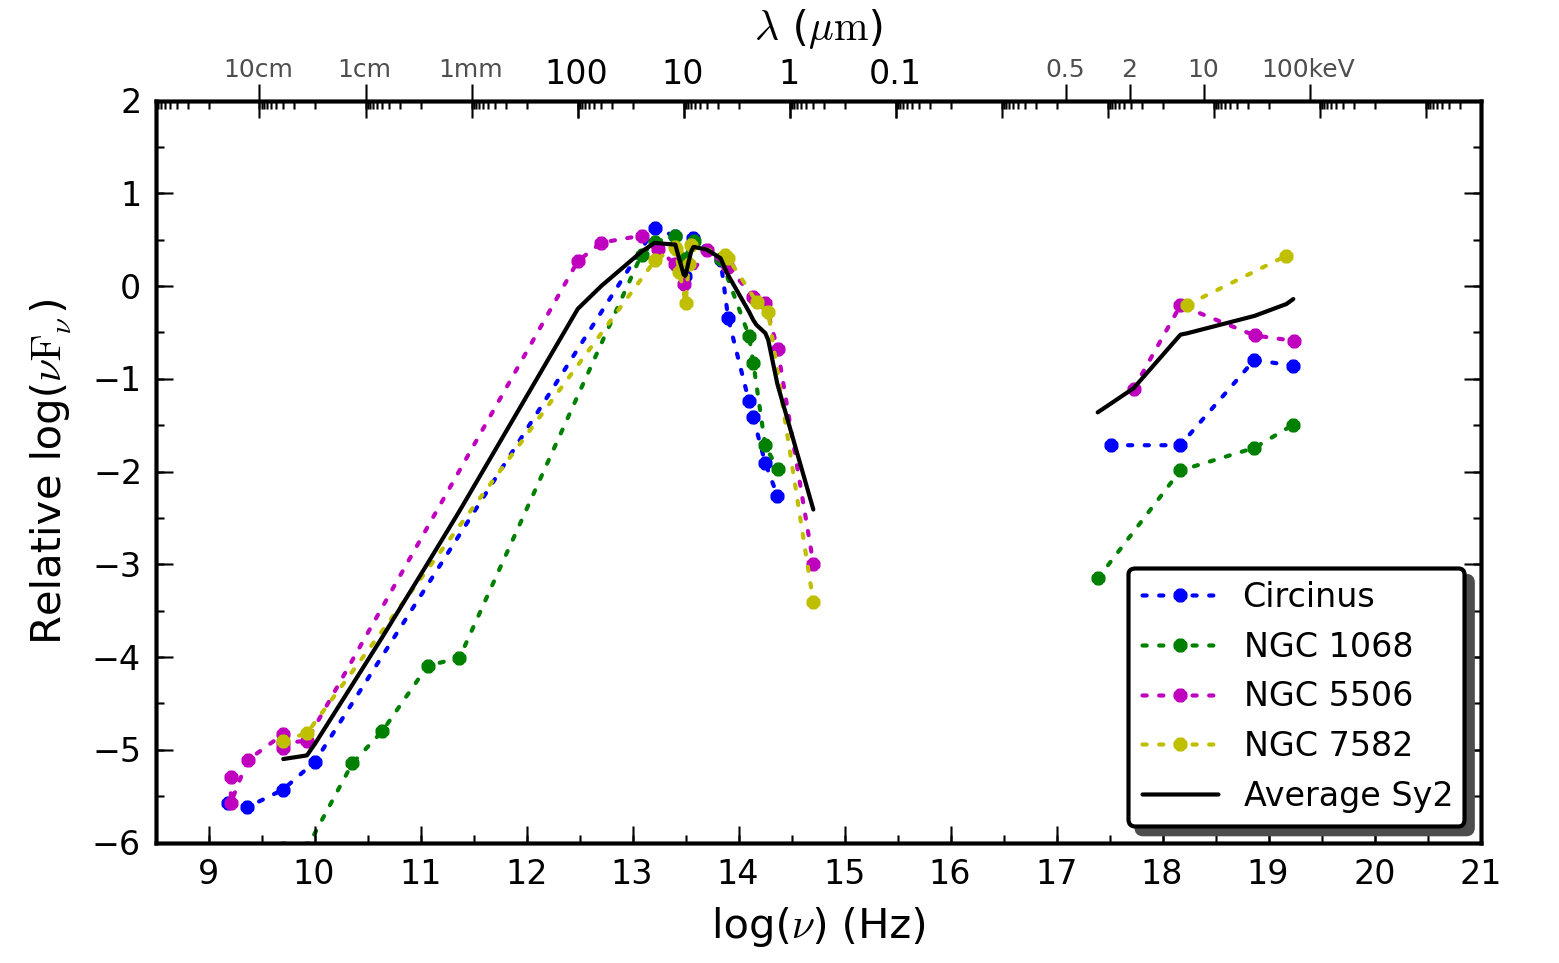
In the figure above, the type 1 template (left panel, black line) is the average of the high spatial resolution SEDs of NGC 3783, NGC 1566 and NGC 7469; the type 2 template (right panel, black line) is of Circinus, NGC 1068, NGC 5506 and NGC 7582.
Average high spatial resolution SED of extragalactic star clusters
The average SED of 37 nuclear star-forming regions in the central 150 pc of NGC 253 are provided here in tabular form: without applying extinction correction (right plot figure below) and after correction (left plot figure below). This average is taken from Fernandez-Ontiveros et al. (2009). First column is frequency, nu in Hz, second is power, nu*Fnu, third and four are respectively, the 25 and 75 per cent quartiles of the distribution, fifth is the mean-value-plus-3-times-the-dispersion of the average background around each cluster. All columns except the first are in Hz x Jy. This average spans the optical-IR (0.5 -20 um, 37 regions) and radio (2.3e+10 - 1.3e+9 Hz, 7 regions out of the 37) ranges.
Prior averaging, each cluster SED was: 1) corrected by extinction using the locally measured value of Ha / Bra ratio; 2) normalized to the luminosity of cluster number 5, taken as representative of the sample. The SED of this cluster shown in green circles in the figure bellow.
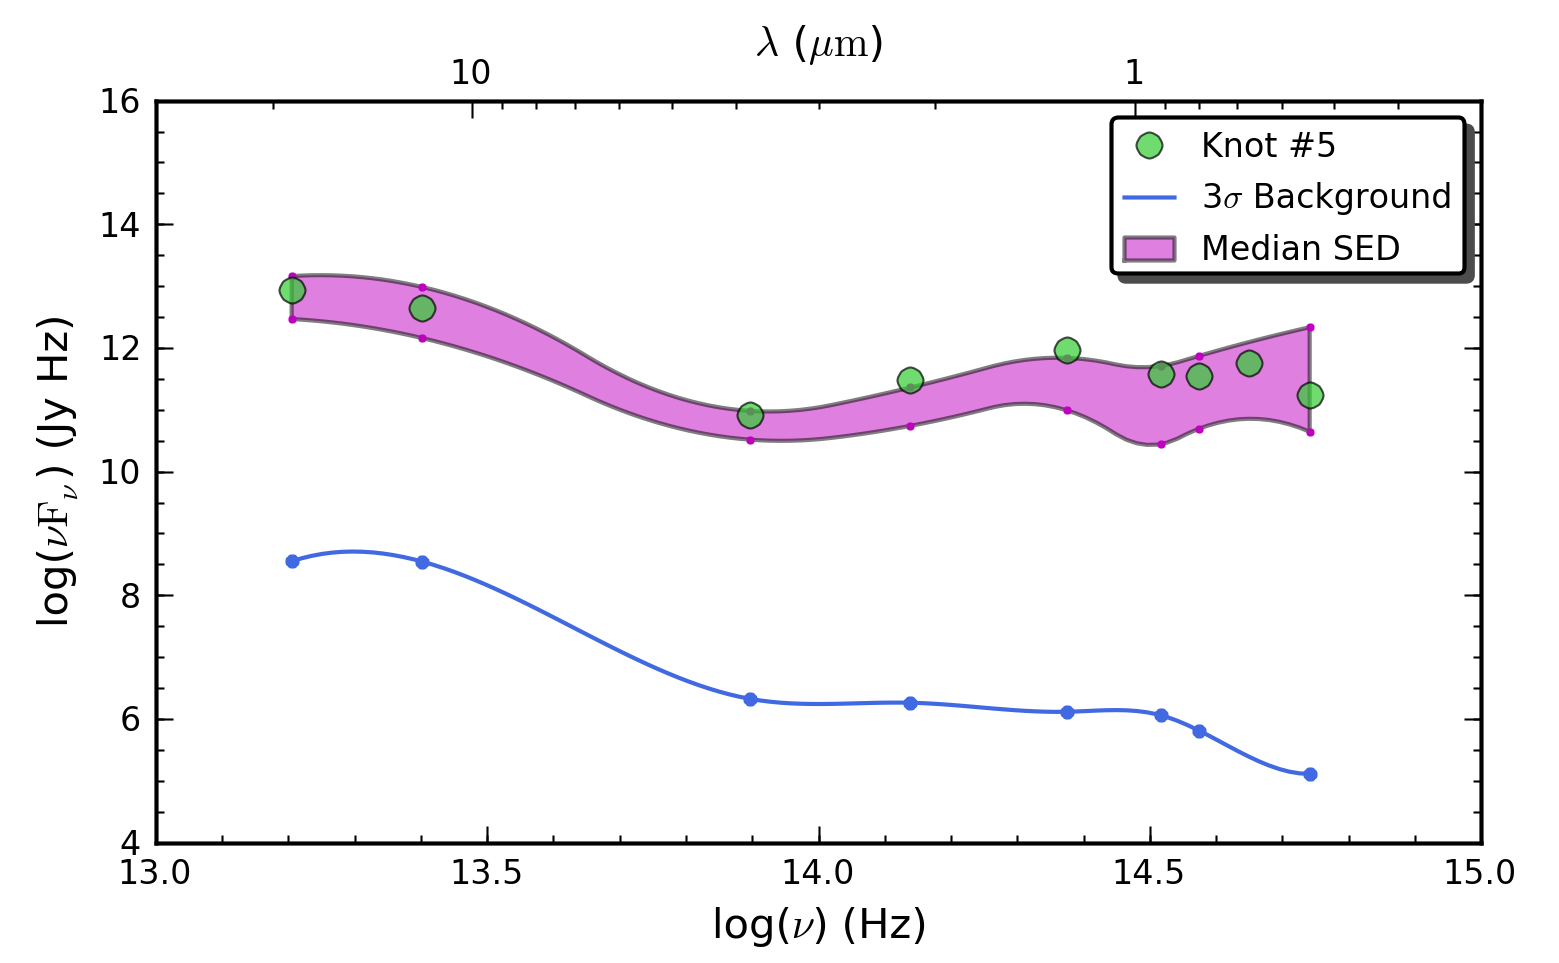
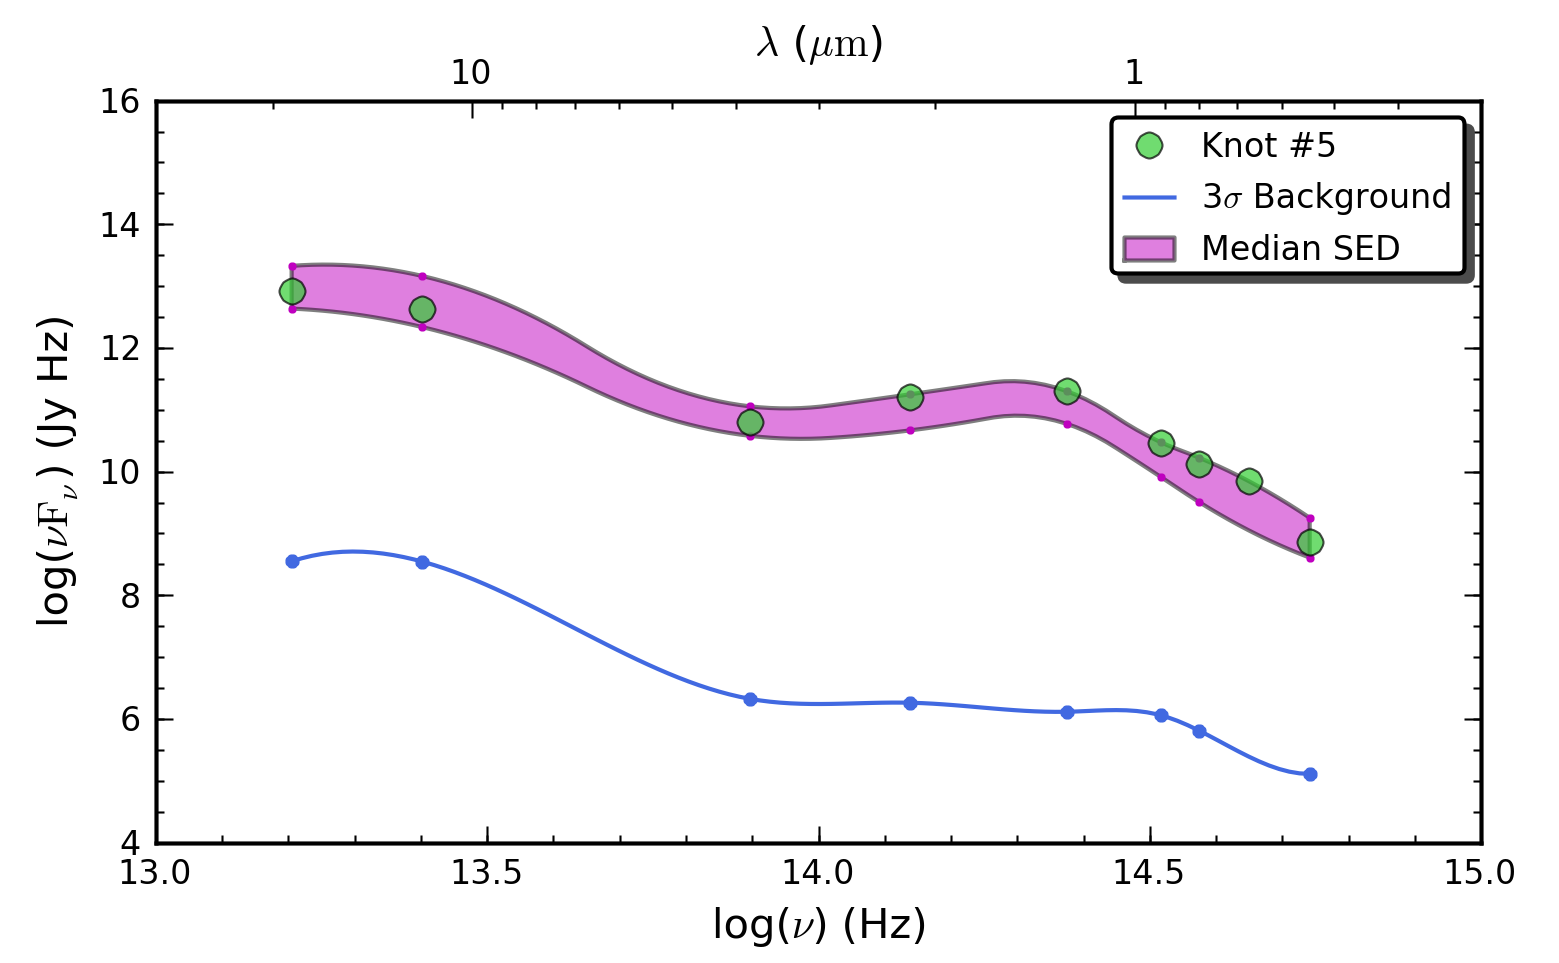
The figure above shows the median SED of 37 nuclear star forming regions:1st. plot is after correcting each cluster SED by its corresponding extinction value measured individually in each cluster via the Ha / Bra ratio; 2nd. plot is same average without extinction correction. Green circles trace cluster #5 SED taken as a reference.