INTEGRAL/WYFFOS

![]()
INTEGRAL/WYFFOS
![]()
|
INTEGRAL is an IAC instrument and is part of the Euro3D consortium. It has been much used for observations of a large variety of astronomical objects; gravitational lenses, Herbig-Haro objects, planetary nebulae, AGN host galaxies, etc.). We would appreciate notice of any papers that result from your use of INTEGRAL.
We also appreciate any feedback observers or applicants have on these pages. In particular let us know if there is any information that you require which is not provided here, or could be better explained. Email the INTEGRAL instrument specialists, Luis Lopez Martin (luislm AT ll DOT iac DOT es) or Evencio Mediavilla (emg AT ll DOT iac DOT es), with your comments.
For information about the CCD, gratings, filters, etc., go to the WYFFOS web-pages.
These web pages are still being updated, so there will be some broken
links and missing information. However, all information necessary for writing
a proposal should be here.
![]()
Various manuals for the reduction of your INTEGRAL data within IRAF have been written. Linked here are the on-line manuals for this, for the technical details of INTEGRAL, and for preparing and carrying out your observations.
The original maual details the installation and use of INTEGRAL, and all its technical details. It was written for INTEGRAL in its first general-use set-up; certain details would have changed since then. In addition, one could consult the manual for installing the IRAF-based software, and an old data reduction manual.
For the the most recent version of the on-line manuals, suitable for the general user or support astronomers, click on set-up, observing, and quick look procedures.
In
addition, basic instructions for
data reduction are
provided; that which you will need to know for
your observing. More detailed data reduction advice, written for the general
user, can be provided by the INTEGRAL team, who can also advise
on the post data-reduction analysis of your 3D data,
using especially the software produced by the
Euro3D consortium
(eg. de-crowding, line-fitting, mosaicing,
visualizing).
![]()
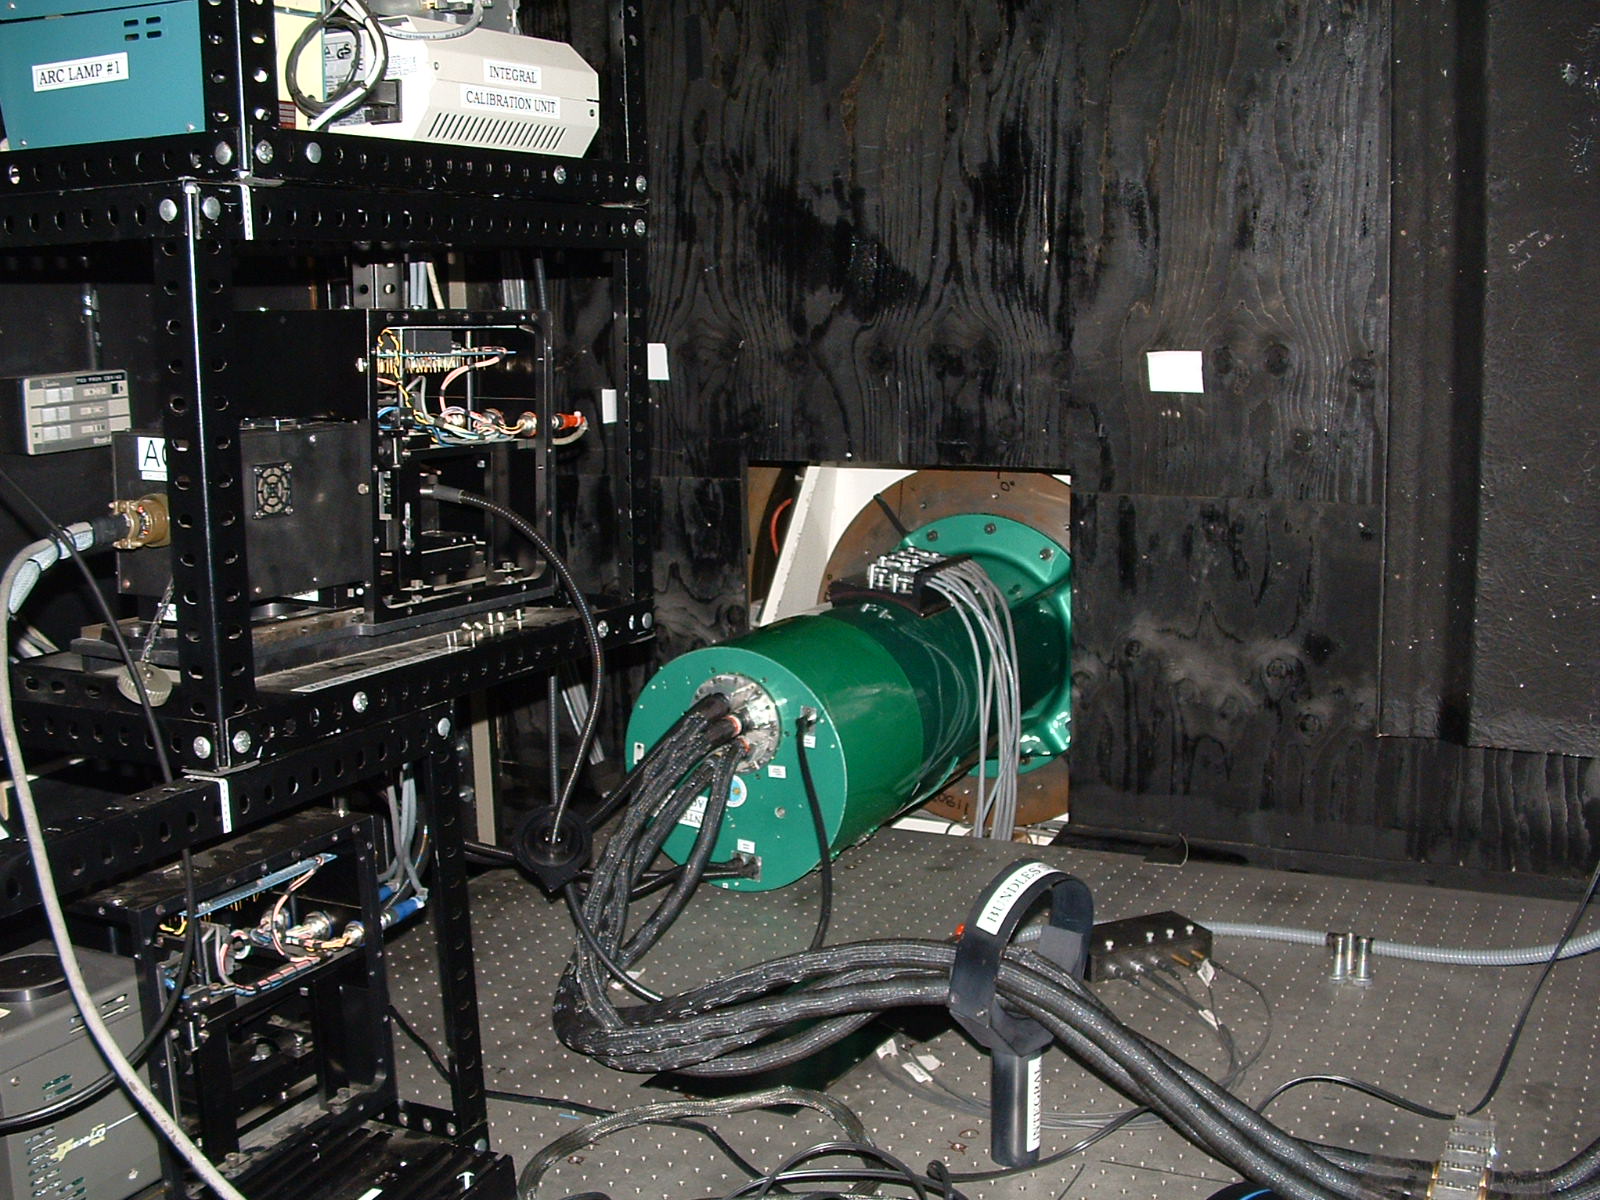
Up to six scientific bundles can be simultaneously mounted in the Swing Plate (SP), which is located in the WYFFOS focal plane. In our current configuration four are used: STD/SB1, STD/SB2, STD/SB3, and a still experimental "coronographic" bundle (with the central fibres in the main bundle blocked to about 1% transmission). The fibres are 5.5-m long, and have core diameters (in arcsec on the sky) of 0.45 (SB1/Corono), 0.9 (SB2), and 2.7 (SB3). They are not contigous on the plane of the sky, bundle SB2 losing about 40% of the light in gaps, compared to a completely solid coverage of the whole field-of-view. The bundles are connected to the entrance pseudo-slit of the WYFFOS spectrograph. They can be interchanged very easily, with an overhead of a few seconds. Hence, the observing set-up can be optimised to the seeing conditions. When doing so, bear in mind that when observing point sources, it is best to sample the seeing with about 3 fibres.
At the focal plane, for each bundle the fibres are arranged in two groups, one forming
the main rectangular field of view, and the other an outer ring, intended for
sampling the background
(sky)
light. The position angle of the fibre
bundles can be changed from the default 0º, although at non right-angles the
data analysis is more complicated.
Table 1 below details the main characteristics of each
bundle, and Figure 1 is the sketch of the 3 main bundles.
| Bundle | fibre core size (") | number (main+sky) | spatial coverage (") | fibre size (pixels) | diameter of outer ring (") |
| STD1 | 0.45 | 205(175+30) | 7.8x6.4 | not measured | 90 |
| STD2 | 0.90 | 219(189+30) | 16.0x12.3 | 3.5--4 | 90 |
| STD3 | 2.70 | 135(115+20) | 33.6x29.4 | 13--14 | 90 |
| CORONO | 0.45 | 115(115+0) | 6.3x5.4 | as with SB1 | - |
The "coronographic" bundle -- that named "CORONO" above -- has characteristics similar to SB1/STD1 but with the central ring of fibres blocked out (see Arribas, Mediavilla & Fuensalida, ApJ 505, L43, 1998) and no sky fibres. This is intended for observations that require very high dynamic range, for example of very faint nebulous emission close to a bright central star. This experimental bundle has note been used often, but is available.
The fibres are placed in a circular pattern on the sky, rather than left to right, up to down, as shown in these fibre maps. The sky fibres are positioned across the CCD with a group at either end and the rest scattered evenly throughout.
![]()
The dispersion axis on the 2-CCD set-up of WYFFOS is in the X-direction
(rotated 90 degrees to that when WYFFOS is in use). The CCD
can be rotated the other way, if you so wish, however you will then lose the
spectra from the central fibres. Our recommended set-up results in full spectral
coverage for the fibres, but with a gap of 105 pixels at
the mid-point where the two CCDs join. The fibres are well separated and fit
easily onto the CCD (goto image of a flatfield on this
page).
INTEGRAL uses the same gratings as does WYFFOS, although the spectral details
will be somewhat different. We have not provided information for the echelle
or for the H2400B and H1600V gratings which are available for use, although
their relative performance with respect to the 1200 g/mm can be obtained from
WYFFOS
web page (in a previous incarnation of INTEGRAL,
the echelle had a factor of 4 better dispersion at around
5000Å than did the 1200 g/mm).
Table 2 below
lists the mean values of spectral resolution, linear dispersions, and
wavelength coverage for various
INTEGRAL set-ups.
Note 1: It is as a consequence of the different fibre sizes on the CCD that the spectral resolution depends on the fibre bundle in use. In addition, due to the variation of the WYFFOS focus over the CCD, the spectral resolution varies also; being worse at the edges and best in the mid-regions. You should note that this has the consequence that if adding together spectra from different parts of the CCD (ie. different apertures), the final fwhm of your spectral lines (ie. your spectral resolution) could be worse that that for each individual spectrum; by how much depends on the set-up you use and which and how many spectra you add together.
Note 2: For bundle SB3, the spectra on the CCD are very wide, hence we recommend binning by a factor of 2 in the spatial direction. You could also bin in the spectral direction; this will not degrade the spectral resolution, as one is oversampling, and would make the spectral profiles of the (arc or astronomical lines) closer to Gaussian (as opposed to top-hat). The dispersion given is for SB3 is for no binning.
Note 3: The spectral coverage values given here are approximate (although not far off). There is some vignetting of the CCDs at the ends, and hence the first and last 100-150 pixels are not useable. In addition, one must take note of the 105 pixel gap between the two CCDs.
Note 4: There are no significant arc line bluewards of 4277Å, which is itself very faint. We found that for the 1200B grating at such a blue setting, it was not, in fact, possible to wavelength calibrate the spectra correctly bluewards of about 4100Å. It was possible to get all the spectra on the CCD to have the same calibration (ie. the wavelengths for all fibres were the same, so a spectral line at 3950Å was at 3950Å for all fibres), but the calibration was increasingly incorrect going further to the blue, by up to 6Å.
Note 5: The spectra on the CCD are not aligned with each other in
wavelength space, but are curved such that the wavelength range of the
central fibres is offset with
respect to that of the outer fibres. This curvature is 21, 30, and 72 pixels
for the 300, 600, and 1200 g/mm gratings and bundle SB3, and a few pixels less
for bundle SB2, and less still and SB1. Because each fibre does not begin and end at exactly the same
wavelength as its neighbour, the wavelength coverage common to all fibres
is less than the values quoted above.
![]()
No formal measurements of the sensitivity of INTEGRAL are available, however
we provide here some examples of past observations of stars and nebula, from
which one can bootstrap to calibrate exposure times.
We provide here some examples of spectra taken with the old and new INTEGRAL setups (the difference being the WYFFOS CCD, changed in the summer of 2004). There will not be a large difference in the performance of the CCD (the only change that affects the sensitivity of INTEGRAL observations) between the old and new setup.
The first is for the spectrophotometric standard star Feige 34 (V=11). This was observed in the old setup, with the 1200B and R gratings, bundle SB2, airmass 1.07, 60s, Jan. 15, 2004, at UT 03:04:56, under good but not photometric conditions (moon coming up and some thin cloud about), and the sum of 19 spaxels of 0.9 arcsec (note that this does not mean the average for a single spaxel is the plot divided by 19, because most of the flux is found in the central 7 spaxels, and in fact 65% of the flux comes from the central spaxel). The spectrum has been corrected (for everything) and flux calibrated note that using this to calibrate the astronomical spectra, we found the fluxes were 30% too high, probably due to the presence of clouds. The flux units of this spectum is, however, the same as that for the HST spectrum used to calibrate against, because of course, that is what you do when flux calibrating. This was corrected for, and the second plot is the the flux calibrated central star of the planetary nebula Abell 30 (V=14.3, almost white dwarf), observed in the blue for 3 hours before Feige 34, and in the red for 3 hours after (ie. this spectrum is a total of 3 hrs), airmass range 1.4 to 1, and the spectrum a sum of 23 spaxels of 0.6x0.6 sq.arcsec as the spatial plane was resampled for its analysis. The third spectrum is the raw spectrum of Feige 34 (throughput normalised and wavelength calibrated, but nothing else; as evidenced by the mismatch between the blue and red grating data, and the dip in the red). It is the sum of 19 blue and 13 red spaxels (again, most of the flux will be in the central spaxels), from the original SB2 (0.9 arcsec) spatial sampling. (For all these plots, ignore the slightly wrong blue wavelengths.)
The following two plots are the flux calibrated Abell 30 nebular spectra, one red and blue (no sky subtraction, so the red spectrum has many faint sky lines in it, and note that there really is no detectable continuum). The point of providing this spectrum is that it could be used to gauge exposure times if you know what flux values you wish to get to. These spectra have been extracted from a single spaxel, for which the observation details are the same as for the central star of Abell 30, above. The integrated flux for the line at 4686A is 3.0e-16erg/cm2/s with 5% measurment error and fwhm of 3.1A; for 4861A we have flux of 2.4e-17 and fwhm 3.6A (the line is a blend); for the line at 4737A the flux is 9.1e-18 and fwhm 3.1A. For the red spectrum, the line at 6548A has a flux of 1.4e-16 erg/cm2/s and fwhm 2.7A, the sky line at 6553 has a flux of 1.1e-17 and measurement error 25%.
Finally, in raw counts is another
spectrum of Feige 34 taken with the new
INTEGRAL setup. Observations were on May 2 2005, grey time (UT 21:52),
airmass 1, bundle SB2 with 600R grating covering about 4600-7800A, and exposure time
240s. The data have simply been extracted from the CCD, with nothing else
done to them, and the spectrum is the sum of 6 spaxels.
![]()
Here we provide calibrated arc maps for a most gratings with bundle SB2, and
images of the arcs for bundle SB2 and SB3 (binned 2x2) with the same gratings,
over most of the wavelength range accessible.
No arcs
for the echelle or holographic gratings are provided,
and please note that there are no significant
arc lines bluewards of 4277 (which is itself very faint). You can contact the
INTEGRAL team if you have questions about the wavelength calibration of your
data, as the wavelengths given in the WYFFOS or ISIS manuals are not the same
as found for INTEGRAL (the arc lamps being different).
Currently the left
CCD is the red, the right CCD the blue.
SB2 (images and calibrated spectrum);
1200 g/mm: 8000Å with 1200R, 6500Å with 1200R, 5000Å with 1200R.
600 g/mm: 4500Å with 600B, 5500Å with 600R , 7500Å with 600R.
300 g/mm: 6500Å with 316R.
SB3 (images only):
There are a few things one should consider, both when writing an INTEGRAL
proposal and when carrying out the observations.
Gratings To change between echelle and reflection, you need to unbolt and move the
whole grating set-up, which is definately not recommended to do during the
night.
Atmospheric refraction
Last updated Dec 2005
This is the web page of INTEGRAL, the author(s) of which commits to respect the
computing code of conduct
of the IAC and the rules about ethics and good use
of the RedIris. The Instituto
de Astrofisica de Canarias ( IAC
) does not
necessarily share the opinions or contents included here, which are only the
author's responsibility.
1200 g/mm: 5000Å with 1200B, 6400Å with 1200R, 7800Å with 1200R.
600 g/mm: 5500Å with 600B, 8000Å with 600B .
300 g/mm: 6000Å with 300B.
![]()
It is
important to realize that to change gratings,
it is necessary to go out into
the dome and physically swap them around inside WYFFOS.
This is not a
particularly difficult job, however it does take some time, and can only be
done with permission from (or done by) the support astronomer or telescope
operator (TO); this is in
case you were to break the grating! This makes it more complicated when
trying to fit all your sky flat-field exposures into twilight, and when to observe
spectrophotometric standard stars, etc. In addition, since the
atmospheric conditions and atmospheric refraction
change with time/airmass, to swap from eg. red to blue wavelengths
in the middle
of the night while observing the same object, will make
your subsequent data reduction and patching together of the spectra more complicated. It IS possible to correct your spectra for
such affects, but it will not be a perfect correction (although for many
scientific programmes this will not be important). In any case, we recommend you
consult the INTEGRAL team if you feel it is absolutely necessary to swap
gratings during the night.
To correct for the effects of
the differential atmospheric refraction it is extremely useful to have a
point source (or near-point source) in the field of view. Bear in mind also, that if you are
observing over a wide range in wavelength and your object only just fills the
IFU's field of view, then the effect of the DAR over time could act to move
your object out of the IFU's field of view in part of your spectrum
(especially if the
guiding of the telescope is done in a different wavelength). Therefore, if
possible, aim
to have uninteresting sky at the borders of your observed region.
![]()
Katrina Exter (Instrument support scientist), katrina AT ll DOT iac DOT es
originally written by
Begoña García-Lorenzo
Ana M. Pérez-García