
Our first goal is to pursue a complete statistical characterization of the human brain. This characterization will naturally depend on the specific scientific objectives and the spatial or temporal scales involved. Initially, we are focusing on structural MRI data, but we have also begun working with functional data and the connectome.
By considering a brain image as a probability distribution function, we ask ourselves which summary statistics are required to achieve a complete characterization of brain aging.
In this work, we have adopted an approach analogous to that used in the generation of synthetic galaxy catalogs for studying cosmology through galaxy surveys. In that context, a fundamental challenge arises from the fact that we have only one experiment—the observable Universe is unique. Although we can divide observations into sub-volumes to mitigate this limitation, many aspects of cosmological analyses rely on the largest possible volumes, restricting the applicability of such subdivision methods.
Another major difficulty lies in computational constraints: it is not feasible to perform a single numerical simulation that simultaneously covers the entire observed cosmic volume of modern galaxy surveys and resolves the gravitationally collapsed structures hosting the observed galaxies. Consequently, fast approximate methods have been developed that utilize summary statistics to accurately reproduce the results of more computationally expensive simulations performed on smaller volumes, as well as to closely match the observed data themselves.
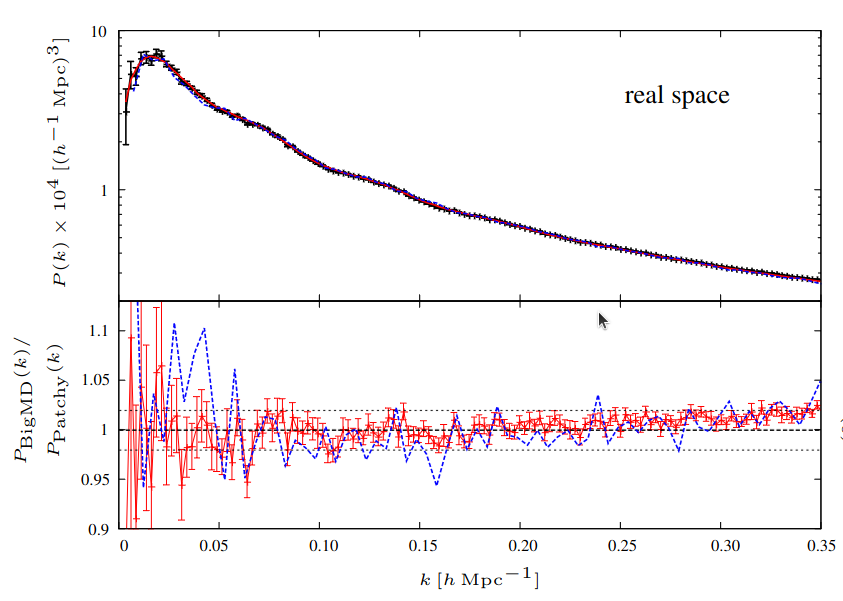
In particular, we found more than a decade ago ( Kitaura et al. 2015 ) that it was possible to reproduce the power spectra (i.e., the two-point statistics in Fourier space) with accuracies better than a few percent, even when using completely different bias models to describe the nonlinear relationship between the discrete distribution of luminous tracers and the underlying, approximately continuous matter distribution.
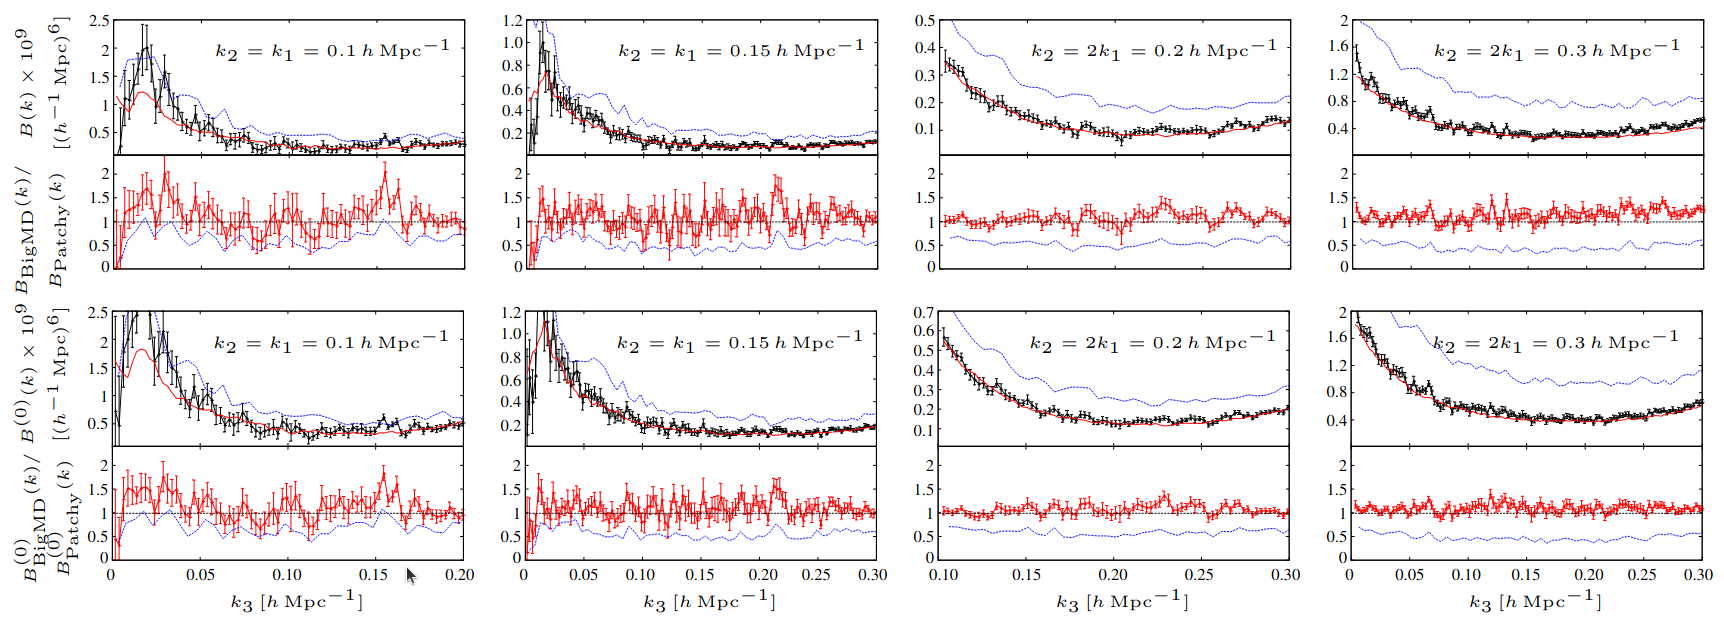
When analyzing the bispectra (i.e., the three-point statistics in Fourier space), we found clear differences of up to 60%. This result motivated the idea of introducing bispectrum analysis into neuroscience.
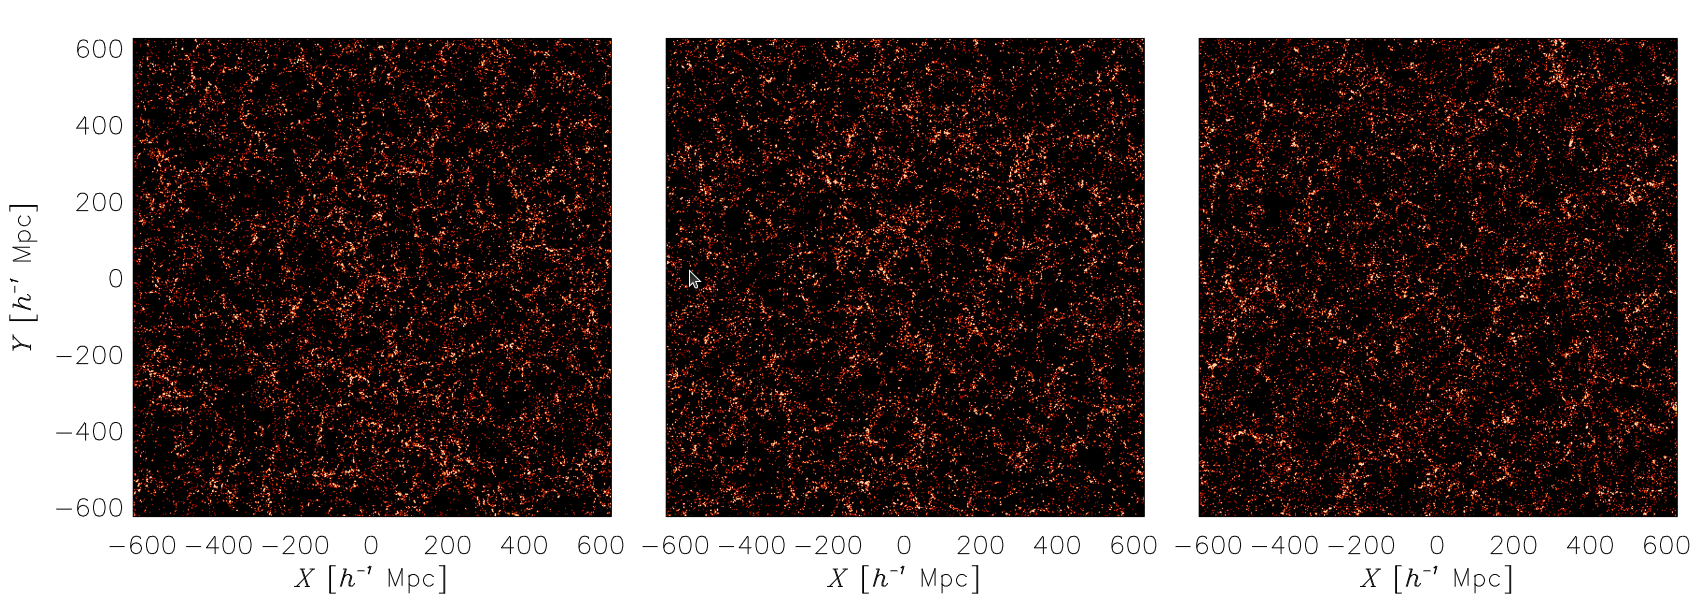
The panels below represent the simulated distribution of Luminous Red Galaxies as obtained with different models. It is hard to tell the differences by visual inspection only in the statistical properties, i.e., the size of the empty regions, the distances between peaks and their abundance. The particular arrangement of the distributions looks different because the seed density perturbation used in each simulation were different, emphasizing that we could look at different patches of the Universe, but their statistical properties should be the same. In the context of neuroscience, we could be dealing with different subjects, but the patterns in their brains should show similar statistical properties if they have a similar age and are healthy (and belong to the same gender and share similar habits throughout their lifes).
In these simulations, we showed that the different models shared extremely similar power-spectra:
However, their bispectra could be very different: