Data Adquisition
OSIRIS/GTC Setup
TF tecnique requires the knowledege of the wavelength variation along the intrument FOV, and a dithering process to avoid ghost, cosmic rays and other effects in the TF images, such the gap in OSRIS detector; in adddition not all the OSIRIS FOV can be used for science analysis, but a portion of it. The right figure shows the science area of OSRIS FOV (enclosed in the blue square). The figure also show the central gap of OSIRIS detectors (where sources are recovered by the dithering process), and the centro of the OSIRIS FOV, wich is not at the center of the ussable FOV.
Extensive documentation about OSRIS in general and the TF technique in particular can be found in the Chapter 3 of the OSIRIS user manual . This information are sumarized in the Blas Cabrera turtorials Blas Cabrera Tutorial: Observing with a TF and OSIRIS TF Manual (with new calibration). OTELO survey follows the procedures described there.
Figure: RAW OTOELO TF image; OSIRIS FOV center is maked with a cross; science targets are restricted to the dashed area of the OSIRIS FOV.
Observations, were taken in the period between April 2010 and June 2014 distributed in 108 observing blocks (OB; each observing block corresponding to a 1 raw hour), using guaranteed time of the OSIRIS team. It is, 107.46 h (108 OB x 3588s) of total observing time and 66 h (36 TF x 6 pointings x 1100s) of effective observed time, providing a total of 216 RAW images (36 TF x 6 pointings)
Data reduction has been done following standard procedures; brief summary of involved processes to obtain the science data is shown in the following figure.
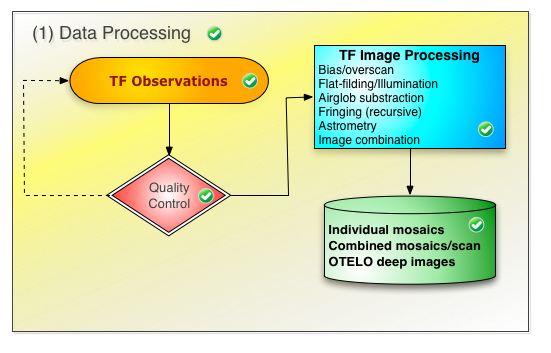
Figure: Overview of data processing the OTELO survey
| Parameter | Value |
|---|---|
| Bluest[1] TF central λ | 9070 Å |
| Redest[1] TF central λ | 9280 Å |
| Δλ between TF | 6 Å |
| FWHM of TF | 12 Å |
| # of TF | 36 |
[1] These values corresponds to the center of OSIRIS' FOV, however they depend on the position of the source in the FOV
TF configuration in OTELO survey has been optimized to allow the deblending of Hα from [N II]λ6583 line (see Lara-López et al. (2010) PASP 122, 1495 for further details)
The final TF configuration is summarized in the left table.
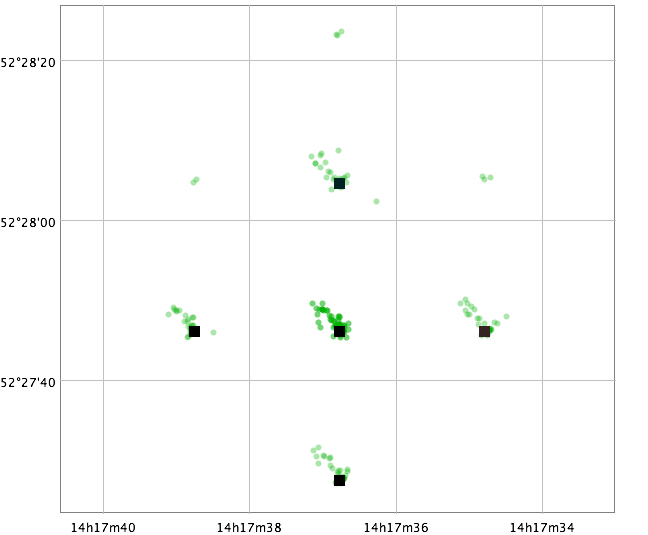
The original set up of the survey incluse a cross-like dithering patterm of 6 pointings where the cross center is observed twice. The planned shifts were +/- 19 .5 arc.sec in RA and +/- 18.5 arc.sec in Declination (Dec.). However, since observations were done in different nights, there was deviations from this planned configuration. Figure below show the pointings of the 108 OB, marked in green, where the mode position of each pointing group is maked in black. Note that 1st and 5th pointings are equal, corresponding to the center of the cross.
| Pointing | Coordinates |
|---|---|
| Pointing 1 |
RA: 14h 17m 36.77s
Dec: 52o 27' 46.08"
|
| Pointing 2 |
RA: 14h 17m 34.79s
Dec: 52o 27' 46.08"
|
| Pointing 3 |
RA: 14h 17m 36.77s
Dec: 52o 28' 4.58"
|
| Pointing 4 |
RA: 14h 17m 38.75s
Dec: 52o 27' 46.08"
|
| Pointing 5 |
RA: 14h 17m 36.77s
Dec: 52o 27' 46.08"
|
| Pointing 6 |
RA: 14h 17m 36.77s
Dec: 52o 27' 27.58"
|
Figure: Black squares: Position of the planned pointings; they have a displacement of 19.5 arc.sec in R.A. and 18.5 arc.sec in Dec. Green squares: Actual possitions of the 108 pointings in OTELO survey, each pointing corresponds to a different Observing Block
Table: Coordinates of the mode of the 6 planned pointings which follows a pattern where 1 & 5 are centered in the same point.