Checking the RAMPs
From the very beginning we in the EMIR team have been concerned with the noise and lack of stability in the detector data frames and have tried several methods to alleviate these problems. As a result the EMIR data are corrected on-line for the Dark Current (DC) level and detector drift using the most up to date calibration data, taken on routine basis. The correction is performed by the EMIR Control System (ECS) and is transparent to the the user.
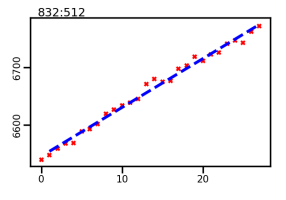
But it may also be that the on-line correction is not sufficient, or just inappropriate, and that needs to be fixed before going ahead with the reduction process. Hence, each user is encouraged to monitor the data after its receipt. The monitoring is rather simple and mainly consists in plotting one or several ramps and check whether the data follows a linear trend or there is one or more points at the beginning that deviates and form a kind of shoulder with the remaining data points. This has to be repeated for each band and each integration time present in the observing run. Below, there are two examples of raw ramp data with and without proper DC and drift correction.
 |
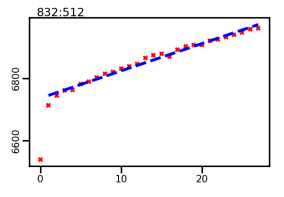 |
The figures displayed above have been produced with the plotramp.py script (new version). This script takes the whole series of raw data frames, that need to be at hand, and produces a composite plot of 32 panels, each one showing the corresponding data points of the central pixel on each detector channel. That should be sufficient to asses whether the ramp is properly corrected. The coordinates of each detector pixel are shown at top left. The new version also display the numeric slope of the fitted ramp (blue line). Users can also use another scripts of their own to do the checking.
To run the script, do as follows:
- First, without arguments
python3 plotramp.py
This script needs 3 arguments:
* the point from which to fit the slope.
* the folder to get the raw data.
* the first id number of the raw data.
- Now with arguments
python3 plotramp.py 3 ./tests 1809576
Procesados ficheros: 1809578 1809579 1809580 1809581 1809582 1809583 1809584 1809585 1809586 1809587 1809588 1809589 1809590 1809591
And there will be a file 1809576-1809591.png in the ./tests folder. The file name is composed by the first and last id of the raw data files, 1809576 and 1809591 in this case. But in the output the first processed file is 1809578 because the command line instructs the script to start processing, i.e. fitting the ramp, in the 3rd data point, so the first two files are skipped in the fitting while the script plots the full point set. Please, bear in mind that this script DOES NOT produce any fitted data. The blue line and the numeric value of the slope are only for your own checking purposes.
In case, you decide to re-processed the data, please proceed to the next step.